![]()
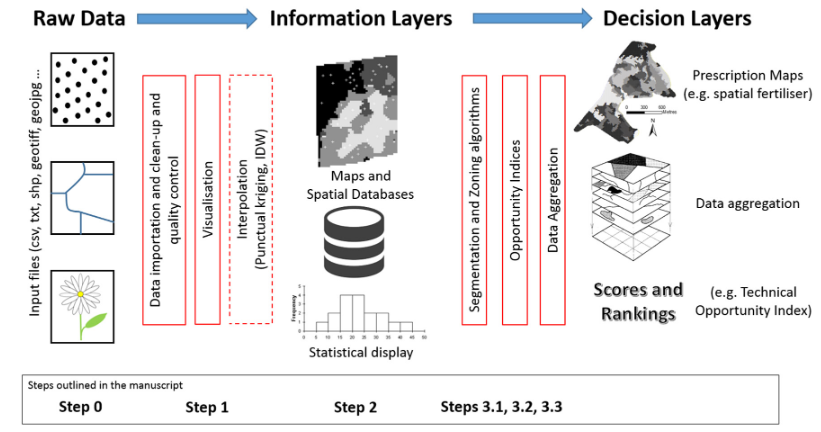
All the data acquisition systems positioned in and around agricultural fields generate a very large amount of information on the functioning of production systems. However, this raw data from the sensors alone is of little interest. This data must be placed in a particular production context and processed with tailor-made algorithms in order to be transformed into decision and information layers that can be used by the end user (farmer, advisor…). With this context in mind, a team of scientists from mixed research units (INRA, IRSTEA, Montpellier SupAgro) developed the GeoFIS tool. This open-source platform (downloadable here: https://www.geofis.org/fr/) aims to provide a set of algorithms from the latest research developments to process its data in Precision Agriculture, and especially spatialized data.
One of the great advantages of GeoFIS is also to allow expertise to be integrated, leaving the user’s hand in the processing of the data. Although the use of GeoFIS does not require any particular programming skills and the interfaces are quite intuitive, GeoFIS remains mainly dedicated to researchers and students wishing to process their data, but also, to a lesser extent, to agronomists and advisors with sufficient training in the field of spatial analysis. The objective of this post is to present in a rather fast and visual way the possibilities offered by this open-source platform. If you want to know more about GeoFIS, a more technical documentation is available online (https://www.geofis.org/fr/fonctionnalites/) and a scientific article was published Leroux et al. (2018) 1.
Display your data
Exploring and understanding your data is essential before embarking on more advanced processing steps. One of the great advantages of spatialized data is that it can be displayed on a map! And it’s pretty nice! GeoFIS offers a simple interface to display spatial data in different input formats (vector, raster…), to choose the projection system associated with its data, and to colorize them with color palettes. The visualization tools allow you to navigate (move / zoom) through these data to look at them in a little more detail. The visualization interface is not surprisingly much less advanced than that of other geographical tools (such as QGIS) but it has the advantage of being very simple to master. Note that it is not possible to export the visualization window to make a figure out of it (unless you make a screenshot of it of course…). A small passage through QGIS is more appropriate if the objective is rather to generate a clean rendering for a figure.
Nettoyer / Filtrer ses données
GeoFIS offers a quite ergonomic interface to filter its data in an “expert” way. The available filtering currently only proposes to delete global outliers, i.e. those that deviate most widely from the global distribution of the dataset. No local filter, related to a neighborhood around each observation, has yet been implemented (it will soon be hopefully!).

Interpolate your data
Spatial interpolation methods are necessary when attempting to produce a map of an agronomic property of interest over the entire study area (e.g., a plot). A specific post has already been dedicated to the description of the main spatial interpolation methods used in Precision Agriculture! GeoFIS offers users the possibility to interpolate their data with a geostatistical method, kriging! This approach aims to interpolate the data from a spatial model (the variogram) fitted to the data. To perform its own kriging, GeoFIS provides an intuitive interface to visualize the experimental variogram created from the available data, and to adjust a theoretical variogram (the model) to these data.
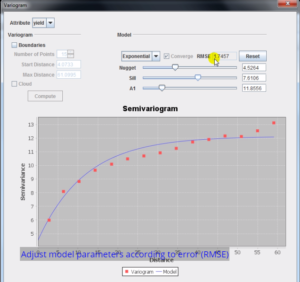
Amongst the available settings, it is possible to choose the extent and granularity of the experimental variogram, the type of the theoretical variogram model, as well as the classical parameters defining the variogram. It is possible to judge the quality of its adjustment with the mean square error (RMSE) in order to make the theoretical variogram evolve as well as possible. Note that an automatic adjustment is proposed by default! Once the model has been selected and saved, all you have to do is start the kriging procedure.
Create within-field zones
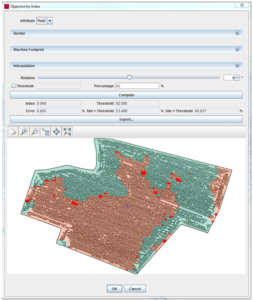
The delimitation of within-field zones is now a widely used approach in variable rate services to simplify the reading and representation of spatialized data, as well as to support agricultural machines in performing variable rate applications. GeoFIS offers in its interfaces a segmentation-based zoning method to generate these within-field zones from punctual spatialized data. The available approach (presented in this article Pedroso et al (2010)3], implemented in GeoFIS. For user-specified machine characteristics (in particular machine width and speed), the algorithm implemented on GeoFIS builds the binarized application map (only a split into two treatments is possible) that maximizes the technical opportunity for variable rate application (i.e. the machine’s ability to perform treatment A correctly on class A areas; to perform treatment B correctly on class B areas; and to minimize application errors, i.e. to apply treatment A on class B areas and vice versa). Once the algorithm is completed, a variable rate application map and a technical opportunity index are available. Note that this process is different from the zoning method also proposed in the GeoFIS interfaces!
Merge multiple layers of information
Operational agronomic decisions are, by nature, multivariate. The choice of a given application from a decision layer (e. g. a fertilization recommendation map) originates from the combination of a set of information layers (yield obtained, soil fertility, fertilization history…). It is therefore necessary that the decision support tools offered to users allow them to merge a set of layers of different natures (points, polygons…) into a final decision layer that will guide the user’s decision making.
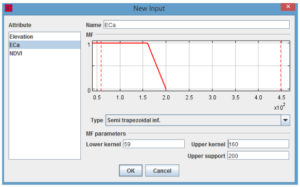
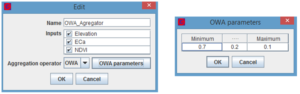
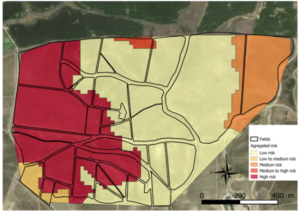
GeoFIS offers a module for merging or aggregating layers in this sense, based on the notion of risk. In the following example, the objective is to define areas in a vineyard plot where there is a risk that agricultural practices are not optimal. This is the decision layer. This decision is based on a set of three layers of information (the soil electrical conductivity, the elevation of the study site and the NDVI, a fairly commonly used vegetation indicator). The GeoFIS aggregation module consists of two distinct steps. In the first one, each initial information layer (conductivity, altitude, NDVI) is transformed into a satisfaction layer or expert layer. This satisfaction layer (between 0 and 1) characterizes the risk that agricultural practices are not optimal depending on the values of the information layer of interest. For example, in the figure, if the soil electrical conductivity is less than 160 mS.m-1, then the risk is maximum. This risk then decreases for increasing values of electrical conductivity and then reaches zero. The second step of the module is to aggregate the whole layers of satisfaction created. Several metrics, more or less simple (average weighting [WAM] or ordered weighting [OWA]) are available to merge the values of these satisfaction layers.
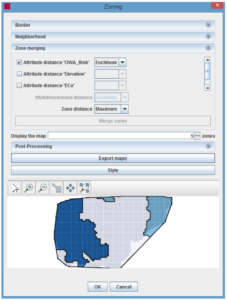
Once the final risk values have been obtained, it is then possible either to present these data in raw form according to the type of data in the information layers (points, polygons, etc.), or to generate risk zones by merging these data data to make them easier to read. Note that one of the main advantages of this aggregation module is to be able to consider non-linear relationships between the input layers of information.
Some last few comments
As you have seen, the GeoFIS open-source platform allows you to do a lot of things to start processing your precision agricultural data. As it stands, it is a truly relevant tool to facilitate the teaching of precision agriculture. In fact, GeoFIS has already been used in many higher education institutions in France to teach researchers and professionals how to process their spatialized data. GeoFIS is a registered product but it is important to note that all products currently introduced and implemented in GeoFIS are still under active study by the scientific community. GeoFIS will be updated when and if improved methodologies become available. One of the strengths of the GeoFIS platform is that it is able to integrate the latest research developments to ensure that users have the most up-to-date, reliable and powerful algorithms. It is also hoped that links will be created between GeoFIS and existing GIS programs, such as QGIS, which is already widely used by many communities working on spatial data. The big advantage would be to be able to process its precision agricultural data using the display and processing algorithms already implemented in QGIS.
Support Aspexit’s blog posts on TIPEEE
A small donation to continue to offer quality content and to always share and popularize knowledge =) ?
- Leroux, C., Jones, H., Pichon, L., Guillaume, S., Lamour, J., Taylor, J., Naud, O., Crestey, T., Lablée, J-L., & Tisseyre, B. (2018). GeoFIS: An Open Source, Decision-Support Tool for Precision Agriculture data. Agriculture, 8, 6
- Pedroso, M., Taylor, J., Tisseyre, B., Charnomordic, B., & Guillaume, S. “A segmentation algorithm for the delineation of management zones,” Computer and electronics in agriculture, vol. 70, iss. 1, pp. 199-208, 2010. /note]), constructs a Voronoi tesselation from all available observations [each observation then becomes a microzone], then merges these Voronoi units two by two according to the attribute gaps observed between two neighbouring units. The area of the zones therefore increases across iterations as zones are being merged (and the number of zones diminishes). Note that several difference metrics exist: for example, two zones can be merged if the smallest or largest difference between two observations from two neighbouring zones is minimal. The algorithm stops when the number of zones requested by the user has been reached.
Technical opportunity for variable rate applications
Delimiting within-field areas only makes sense if the magnitude of variation of the data is high, i.e. there are substantial and important variations to be taken into account, AND that this variation can be taken into account in an operational way by the users and/or agricultural machines that will carry out the modulation (we are looking to see if the variability is structured in space). The characterization of this operational spatial variability has been a concern for the scientific community, which has come to propose technical opportunity indices for variable rate applications, in particular the TOI [Technical opportunity index, Tisseyre and McBratney (2008)2 Tisseyre, B.; McBratney, A. A technical opportunity index based on mathematical morphology for site-specific management: An application to viticulture. Precision Agriculture, 2008, 9, 101-113