Linear modelling of spatial data in R

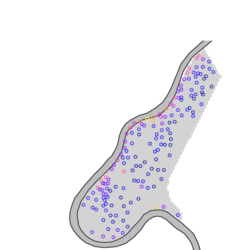
We will work here on a dataset that is fairly well known in spatial analysis – the “meuse” dataset – in order to reintroduce a number of concepts to those who would like to engage in linear modelling of spatialized data. This case study will be treated under the R language. One of the big Read more about Linear modelling of spatial data in R[…]

Data Visualisation with R and Shiny

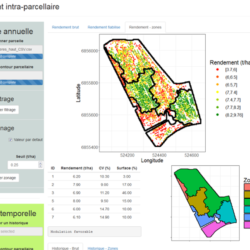
Visualizing your data is THE most important part during your project management (we often talk about “Data Visualization” or Dataviz”). Whether upstream to understand a little bit about how the data are arranged or downstream so that a decision-maker can make an informed decision, there is always a time when we will have to think Read more about Data Visualisation with R and Shiny[…]

Link R and QGIS: Integrate your own R algorithms in QGIS

Parameter setting of QGIS and R The presentation of QGIS is no longer necessary! This open-source platform is now widely used in many domains to visualize, exploit and process spatialized data. The processing functions inherent in QGIS in addition to all those of the associated geographic information systems (SAGA, GRASS…) via the geoprocessing module allow Read more about Link R and QGIS: Integrate your own R algorithms in QGIS[…]

Implementing variograms in R

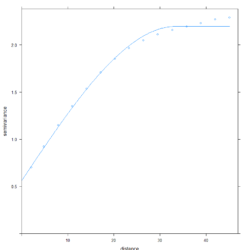
Computing an experimental variogram The usefulness of variograms in Precision Agriculture studies have been largely detailed in a previous post. This is effectively a valuable tool to study the spatial structure of agronomic and environmental spatial datasets. This post will make use of a dataset that was created following the methodology of the post : “Simulating spatial Read more about Implementing variograms in R[…]