If there is one subject that is neglected when working with spatialized data, it is the reference coordinate system. In general, we try to spend as little time as possible on the subject – often because it’s not very clear – and assume that we have collected our data in a super coordinate system or that our supplier/provider has done the work for us (otherwise it’s his fault!). Even so, sometimes we can’t remember which coordinate system was used to collect the data, or we simply receive data without an associated coordinate system. Let’s add to this for example the on-the-fly projection in QGIS which gives us the impression that our layers are well located (after all, QGIS manages to open them!). Then comes the manipulation, geoprocessing of all kinds, and the analysis of these data. And then the trouble starts because we realize that it’s still a mess in the projection of the layers.
Being clear on the coordinate systems before managing a project with spatialized data allows you to avoid many problems!
Geoid
To be able to locate observations on the Earth, you must first know what the Earth looks like and have a representation of it, otherwise you will have little chance of locating anything on it. You may have already heard of the geoid, that dented, deformed and not very sexy shape of the Earth (Figure 1).
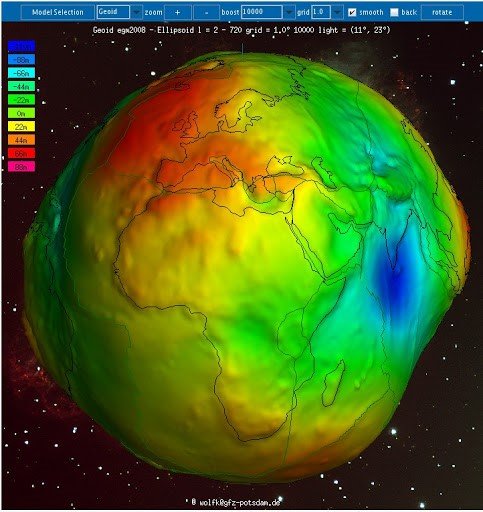
Figure 1. Geoid: reference equipotential surface of the Earth’s gravity field
The geoid is the shape that the ocean surface would have under the sole influence of gravity and the Earth’s rotation. And it is this dented shape that we would have to see by satellite if there were no tide and wind phenomena (in Figure 1, the variations are a bit exacerbated, we shouldn’t see such a deep trough, but it helps to better understand what’s going on). The geoid is one of the surfaces that is considered as a reference for the altitude coinciding with mean sea level. For example, when we say that the top of a hill is 130 metres above sea level, we actually consider it to be 130 metres above the geoid (or another surface, if we don’t use the geoid as a reference).
Ellipsoids
Despite the fact that the geoid is a very good representation of the earth, when you want to start modeling the earth with mathematical equations, it becomes very complicated because there are still a lot of bumps and hollows, so good luck even if you’re really good at math. To limit this problem, one of the actions taken was to approximate the geoid by ellipsoids (Figure 2) since as good mathematicians, we are able to well characterize the shapes of the ellipsoids (lengths of the main axis, and half main axis; I’ll let you go back to your old math classes!). We could also have represented the geoid by a circle (the equation of a circle is even simpler!) but the Earth tends to be flattened at the poles, which has led to the use of ellipsoids instead.
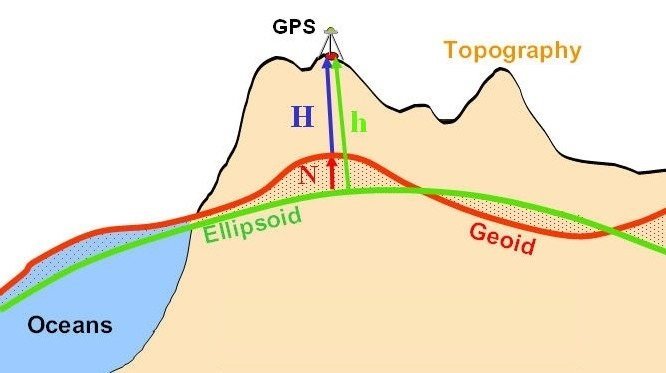
Figure 2. Ellipsoid approximation of the geoid
When we choose a particular ellipsoid to approximate the geoid, we say that we are choosing a “reference” ellipsoid, simply because the coordinates of our observations will be determined based on the chosen ellipsoid. And there are a large number of ellipsoids that are potentially usable because some ellipsoids approximate the geoid better at some locations on Earth than at others (Figure 3). In Figure 3 for example, we can see that ellipsoid #1 is more relevant on the left side of the figure (it coincides better with the geoid) while ellipsoid #2 is more relevant on the right side of the figure.
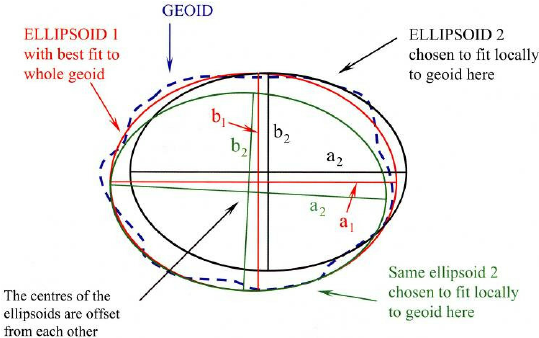
Figure 3. Geoid and ellipsoids. Lengths a and b are used to characterize an ellipsoid.
Once we have chosen our reference geoid and ellipsoid, we finally have our representation of the Earth, and we can start talking about coordinates! We then speak of a geodetic (or geographic) system: a system with a geoid, an ellipsoid, and associated coordinates.
Cartesian coordinates
In a geodetic system whose coordinates are presented in Cartesian format, the coordinates of each observation on the Earth’s surface are given in an X,Y,Z frame originating at the centre of the Earth. The XY plane is in the plane of the equator, and the X axis intersects the meridian of origin (in most countries, this meridian is the Greenwich meridian). The Z-axis is the axis from the centre of the Earth to the poles. In the Cartesian format, we don’t talk about coordinates in longitude or latitude, we just talk about coordinates in the XYZ plane that you see on the figure.
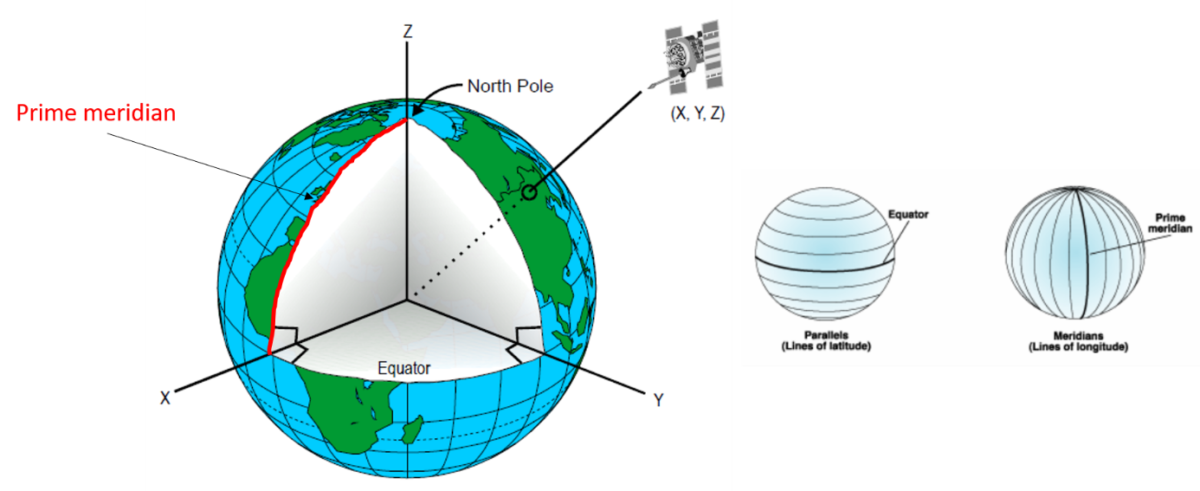
Figure 4. Cartesian coordinate system
Geodetic and geocentric coordinates
In a geodetic system, coordinates can also be presented in geodetic or geocentric form, so we start talking about longitude and latitude! In a geodetic system with geocentric coordinates, the latitude of a point on the Earth’s surface is the angle between (i) the plane of the equator and (ii) the axis from the centre of the Earth to the point of observation (Figure 5). Coordinates are called geocentric because latitude is measured relative to the centre of the Earth. In a geodetic coordinate system, the latitude of a point on the Earth’s surface is the angle between (i) the plane of the equator and (ii) the axis perpendicular to the reference ellipsoid passing through the observation point (Figure 5). The only difference from coordinate systems in geographic and geocentric formats is their definition of latitude. For both systems, the longitude of a point is defined as the given angle between the meridian of origin and the meridian passing through that point. Figure 6 may be more explicit in clarifying how the elements of latitude and longitude are represented.
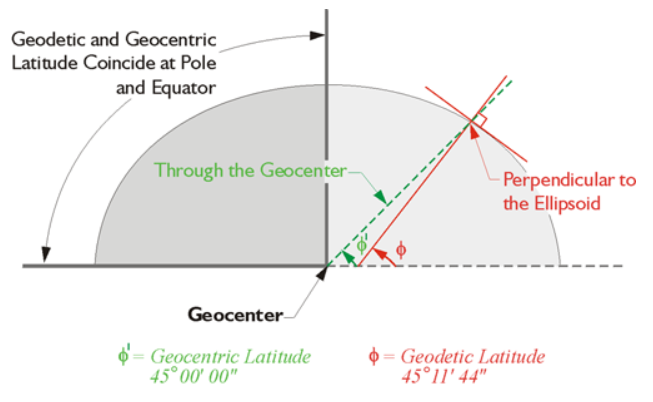
Figure 5. Definition of latitude for a geocentric and geodetic coordinate system
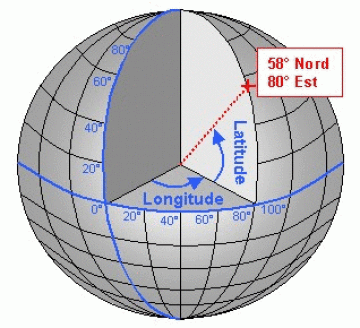
Figure 6. Longitude vs. Latitude
Note that equations exist for moving from a Cartesian coordinate system to a geographic and/or geocentric coordinate system.
Non-projected and projected coordinates
Where we must be very clear is on the fact that coordinates in a geocentric or geodetic format are expressed as angles! Therefore, it is not possible to calculate the distance between two points on the earth’s surface in geodetic/geocentric coordinate systems. To do this, it is necessary to project these coordinates (in degrees) onto a flat map to get metric coordinates! I invite you to go and watch the short video of the Vox channel which explains this in an extremely clear and limpid way.
Just as there is a large selection of reference ellipsoids, there is also a large selection of supports on which geodetic/geocentric coordinates can be projected (Figure 7). Imagine positioning your representation of the Earth in a cylindrical holder (Figure 7a). Project all of your coordinates onto this cylindrical support, cut out your cylindrical support, and you obtain a flat surface on which you have your planar (metric) coordinates. Depending on the support used, you will have flat maps that will be more or less relevant depending on where you are on the Earth. And it is only once you have projected your coordinates that you will be able to calculate notions of distance between points on your map. So be careful when you talk about longitude or latitude if you are in a geodetic/geocentric or planar coordinate system!
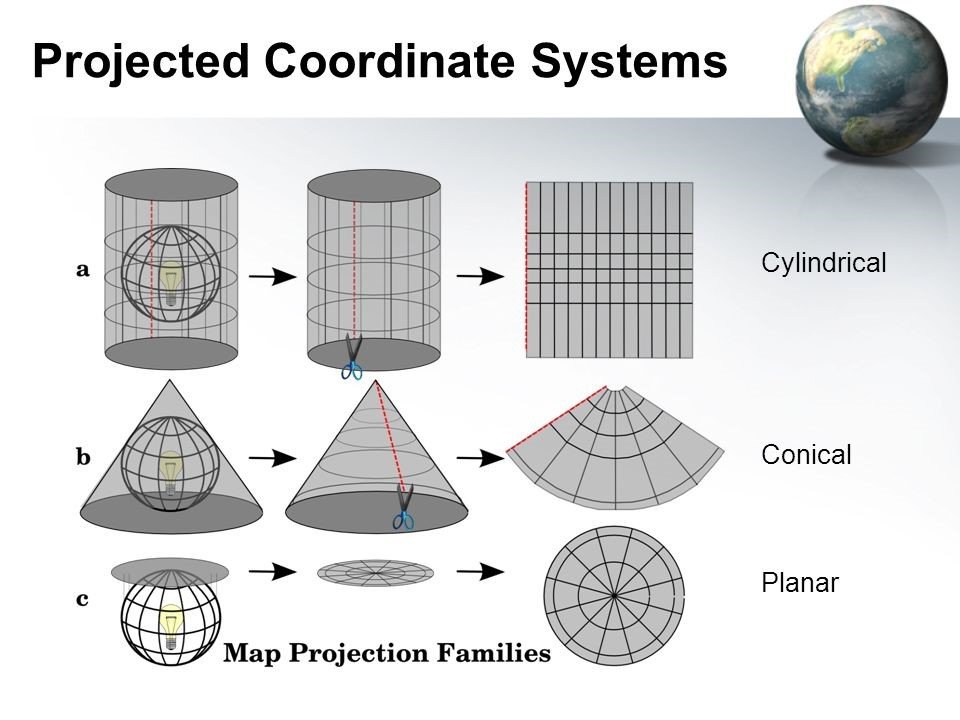
Figure 7. Projected coordinate systems
WGS84 and Lambert 93
Let’s take two examples to try to recontextualize this:
- WGS84: You’ve probably seen or heard of this reference coordinate system before. But have you ever wondered what it corresponds to? Well, WGS84 is a world geodetic system! So the data is not projected! It is a geodetic system with geocentric or geodetic coordinates based on the EGM96 geoid, the reference ellipsoid IAG GRS80, and the original meridian is the Greenwich meridian. Note that most projected UTM (Universal Transverse Mercator) coordinate systems are based on the WGS84 geodetic coordinate system.
- Lambert 93 : In France, we often hear that the data is in Lambert 93 but, once again, did you ever wonder what it was? Lambert 93 is a conical projection (see Figure 7)! It is related to the RGF93 geodetic system – a system based on the reference ellipsoid IAG GRS80, and the reference meridian is the 3rd meridian east of the original Greenwich meridian. Therefore, we would have to refer to the RGF93-Lambert 93 coordinate system if we wanted to be accurate. Until 2001, in France, the NTF (Nouvelle Triangulation Francaise) geodetic system was used. This geodetic system was based on a different ellipsoid, that of Clarke 1880 IGN. Note also that other conformal conic projections are also used to limit certain linear alteration phenomena of the Lambert 93 projection (especially near the borders of France – which are therefore far from the barycentre of France).
To avoid confusion between the different coordinate systems used, a unique code has been associated with each system by the European Petroleum Survey Group (EPSG). The EPSG code for the WGS84 geodetic system is 4326. The EPSG code for the RGF93-Lambert 93 coordinate system is 2154.
Once you are clear on the coordinate system associated with your data, you can quite easily re-project your data into another coordinate system if necessary using specific mathematical equations (already existing in geographic information systems such as QGIS or R/Python functions). And you can then focus on the accuracy of the location of your data in the coordinate system in which you acquired them. For example, you will have a different accuracy depending on the GNSS, DGPS or RTK support used, but this is not the subject of this post (maybe of a future one!).
Support Aspexit’s blog posts on TIPEEE
A small donation to continue to offer quality content and to always share and popularize knowledge =) ?

