Neural network – Let’s try to demystify all this a little bit (1) – Neural architecture

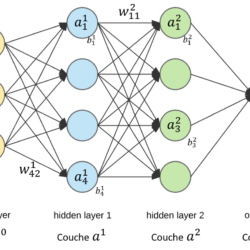
Unless you have emerged from a period of cryogenics or have been locked in a bunker for several years, it is unlikely that you have never heard of a neural network. Having heard about it is one thing. Understanding what can be used is another. Knowing how it works is a whole different matter. If Read more about Neural network – Let’s try to demystify all this a little bit (1) – Neural architecture[…]

Fuzzy logic or the extension of classical logic

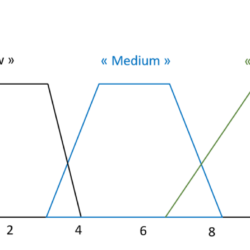
The concept of fuzzy logic was proposed in the 1960s by Lotfi Zadeh, an Iranian mathematician and computer scientist, to tackle the limits of good old classical logic. Which limits are we talking about? Let’s take a first very simple example on the temperature of the water that flows when you take a shower. If Read more about Fuzzy logic or the extension of classical logic[…]

Data Visualisation with R and Shiny

Visualizing your data is THE most important part during your project management (we often talk about “Data Visualization” or Dataviz”). Whether upstream to understand a little bit about how the data are arranged or downstream so that a decision-maker can make an informed decision, there is always a time when we will have to think Read more about Data Visualisation with R and Shiny[…]

Outliers, abnormal data, Let’s take a look at the situation

Few will tell you that their data is all pretty and clean and can be used as is in decision models… That’s a fact. When a dataset is collected, no one is immune to the risk of biased or outliers coming up and disrupting the quality of the data. And there are plenty of sources Read more about Outliers, abnormal data, Let’s take a look at the situation[…]

Link R and QGIS: Integrate your own R algorithms in QGIS

Parameter setting of QGIS and R The presentation of QGIS is no longer necessary! This open-source platform is now widely used in many domains to visualize, exploit and process spatialized data. The processing functions inherent in QGIS in addition to all those of the associated geographic information systems (SAGA, GRASS…) via the geoprocessing module allow Read more about Link R and QGIS: Integrate your own R algorithms in QGIS[…]

Uncertainty and Sensitivity

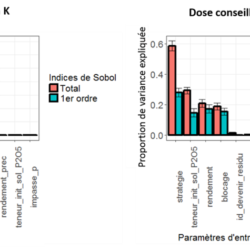
Precision agriculture tools (pedestrian, static, tractor-mounted or airborne sensors, etc.) make it possible to acquire agronomic and environmental data sets at impressive spatial, temporal and attribute resolutions. Generally speaking, we tend to trust these captured data (sometimes too much), i.e., we often use them as they are, without really asking ourselves too many questions! However, Read more about Uncertainty and Sensitivity[…]

GeoFIS : an open source platform to process Precision Agriculture data

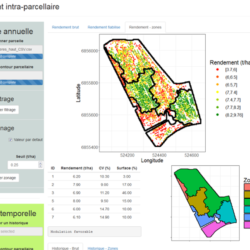
All the data acquisition systems positioned in and around agricultural fields generate a very large amount of information on the functioning of production systems. However, this raw data from the sensors alone is of little interest. This data must be placed in a particular production context and processed with tailor-made algorithms in order to be Read more about GeoFIS : an open source platform to process Precision Agriculture data[…]

Simulating spatial datasets with known spatial variability

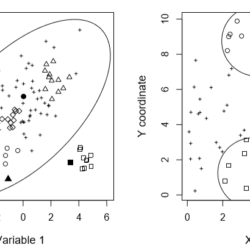
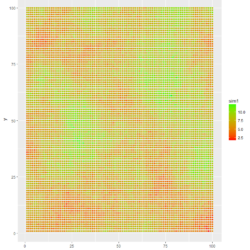
The simulation of fields with varying spatial structures is an interesting strategy when it comes to testing or evaluating a specific processing method. The main advantage of simulations is that one is able to control the data distribution within the field so that the context under which the processing method is applied is well-known. For instance, one might Read more about Simulating spatial datasets with known spatial variability[…]

Implementing variograms in R

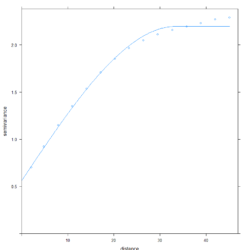
Computing an experimental variogram The usefulness of variograms in Precision Agriculture studies have been largely detailed in a previous post. This is effectively a valuable tool to study the spatial structure of agronomic and environmental spatial datasets. This post will make use of a dataset that was created following the methodology of the post : “Simulating spatial Read more about Implementing variograms in R[…]

How to validate a predictive model ?

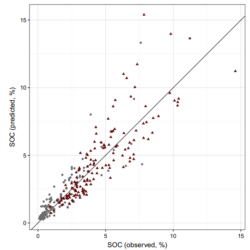
One common task in Precision Agriculture studies is to predict the values of a specific variable. More than often, this variable is likely to be costly or time-consuming to acquire and one tries to develop a more or less complex model to infer the values of this variable. For instance, it is well-known that soil Read more about How to validate a predictive model ?[…]