In spite of the emulation around precision agriculture and digital agriculture in France, it is clear that these tools and solutions are not yet widespread in the field. Some recent statistics from the French observatory of digital uses in agriculture can testify to this:
- less than 10% of farmers used variable-rate tools in 2018,
- as few as 10% of arable land was monitored by remote sensing tools in 2017, or
- Soil electrical conductivity/resistivity has been mapped on less than 1% of arable land since 2017.
One of the major limitations that has not yet been overcome is the ability to demonstrate to farmers that these technologies can be economically relevant in the short and long term. It must be said, however, that this problem has not been resolved because the issue is extremely complex. How, in view of the number of parameters that can influence the result of a farm (climatic factors, management of crop practices, fixed and variable farm costs, volatility in commodity prices, cost of services and technologies…) can we ensure that some solution brings a significant economic advantage? Nevertheless, as the economic issue remains a strong factor of action on changes in agricultural practices (whether these changes are technical or systemic), it is important to focus on tools and methods that can help farmers clarify whether new solutions/practices are economically interesting for them or not.
Yield and Profitability Maps
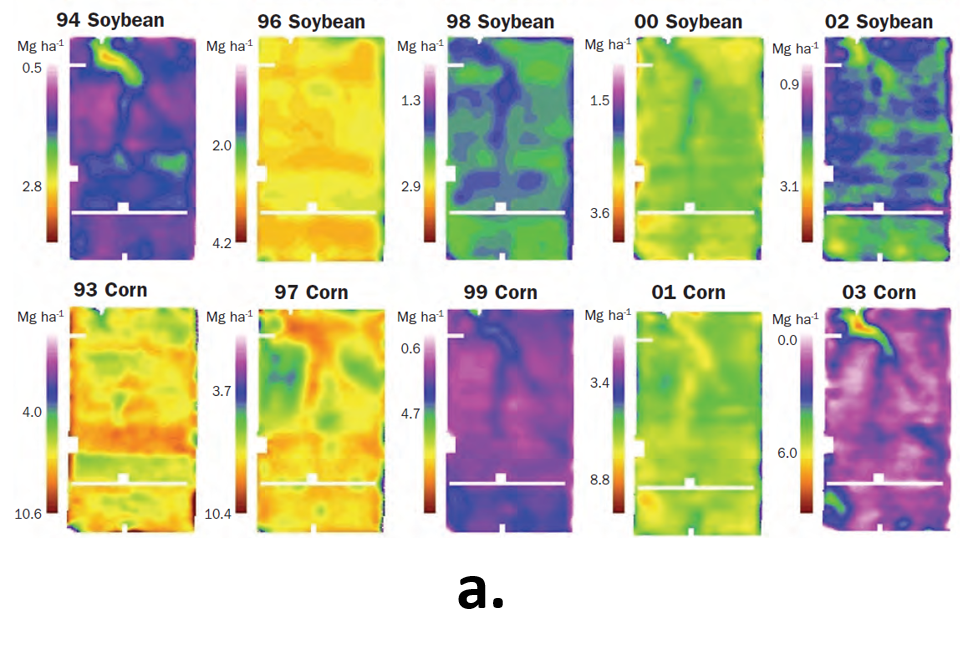
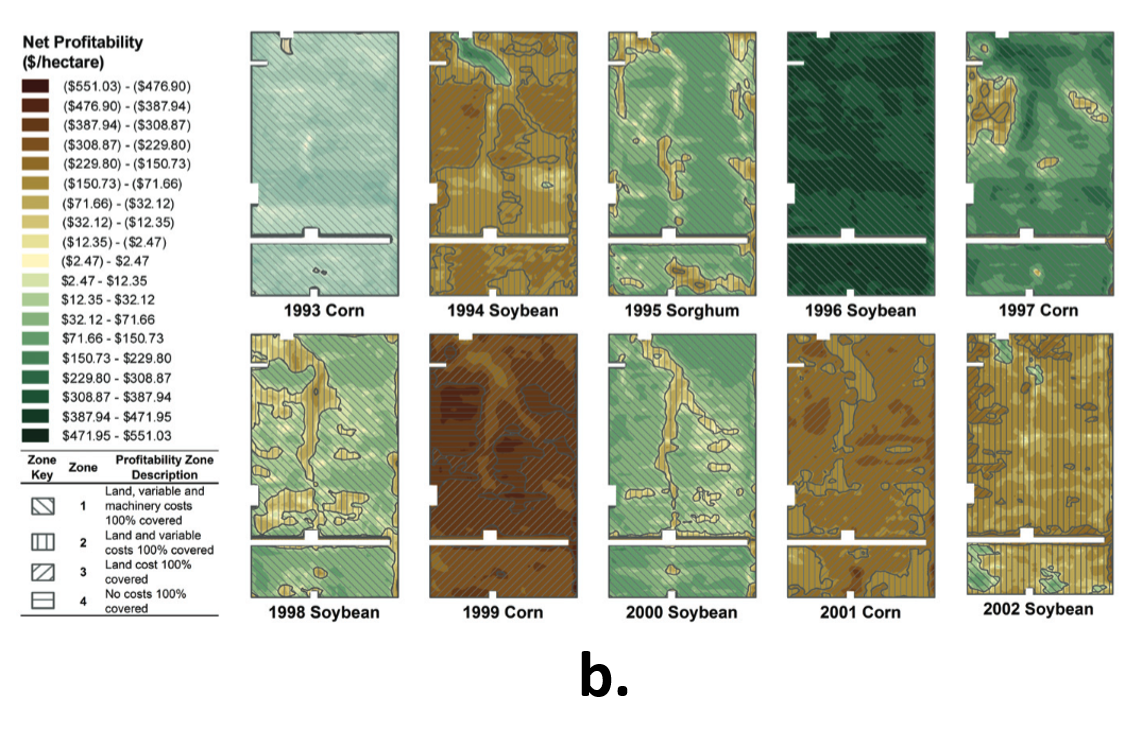
In parallel with this observation, it should be remembered that in France, yield sensors mounted on combine harvesters are very largely under-exploited (the French observatory of digital uses in agriculture will cover the topic soon). For many reasons that have been detailed in a previous post (sensor calibration needs, presence of erroneous data, lack of a robust yield processing chain, lack of interoperability, lack of value-added services…), yield maps have been left aside. Critics of yield maps do not mind, but a major interest of yield maps is that they are the result of all the factors that have influenced production. They are integrative, of course (the causes of yield variations cannot always be explained simply), but they have the merit of summarizing everything that happened during the season. In addition, and this is the purpose of this post, yield is the variable that is the entry point for an operation’s sales and margin. A yield map can therefore be transformed into economic profitability maps (turnover map, gross margin map, etc.) if the selling price of the production, the various subsidies/aids received and all the fixed and variable production costs are added to it (as if a financial profit and loss account were constructed at plot level).
Many service providers work hard to predict this yield indicator on plots (including satellite imagery and/or complex agronomic models), and this is to their credit, although not always for the right reasons. It would nevertheless be a great pity to forget the yield maps when these maps are produced directly during the harvest (from an on-board sensor and therefore without the need for additional machine passage) and are likely to be available on many plots, some of them with a fairly long historical sequence.


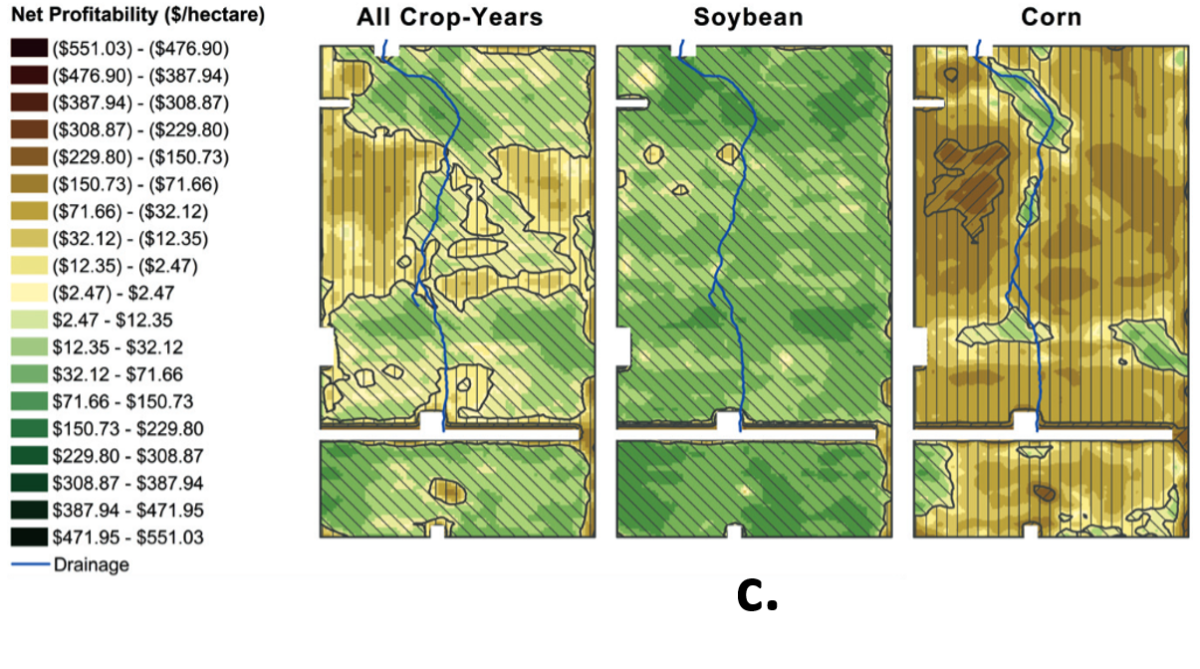
Figure 1. (a.) Within-field yield maps. Colours represent crop yield (Mg.ha-1) (b.) Annual profitability maps. Colours represent net profitability ($/ha). Profit values in parentheses in the legend represent a net loss. (c.) Average profitability maps per crop. Colours represent net profitability ($/ha). Adapted from Lerch et al (2005) and Massey et al (2008).
How do we value these profitability maps?
In principle, economic profitability maps allow us to take a step back from plot management, i.e. to consider all the work that has been done and the decisions that have been made on a plot to assess their relevance from an economic point of view. This can be done at the farm or plot level, but also at the within-field level. The primary objective of these economic maps is to provide a progress report on the practices carried out up to the construction of these maps and thus to validate or not the systems and/or operations implemented. These maps can then be used as a support to improve, redirect or even question a change in practices on the operation. If, for example, following the study of these economic maps, it is observed that the southern part of a plot of land is loss-making or unprofitable, why not imagine a change in practices in this area (setting up an inter-culture, fallowing and/or implementing biodiversity actions…)? An interesting article, published in the “Agronomy Journal”, worked on this subject by proposing conservation strategies on cultivated areas that were not or not very profitable. In this specific case, it is quite obvious that changes in practices can be considered on a farm if significant financial incentives are attached to them (e.g., by increasing the value of crop mixes, intercropping, or soil carbon levels).
Alongside this use, these profitability maps could be used to introduce a notion of risk into the strategic thinking of a farm. Using a yield map, and by imagining different scenarios – volatility in commodity prices, variability of input costs, changes in a subsidy or incentive, etc. – the farmer could better perceive the risk of changing (or, on the contrary, the risk of not changing) his practices.
What is the impact on value chain relationships?
These maps are of interest to several acotrs in the value chain, notably because they can help many actors to validate (or not) objectively their intervention (advice for innovative management practices, relevance of specific digital technologies…). It should also be noted that these maps could help farmers to be in a position of strength with regard to all the actors that revolve around them (advisors, cooperatives, service providers…) because these maps will lead to greater transparency and objectivity.
What are the limits to the use of profitability maps?
If we bring our feet back on the ground, and we really want to be able to take advantage of these profitability maps, a certain number of points must be taken into consideration:
- Unsurprisingly, the quality of the yield map will play a big part, with two big points of attention: (1) on the cleaning of the yield data to ensure that the data present correspond to the cropping itinerary (and therefore that there are no biased and/or erroneous data), and (2) that the yield sensor has been correctly calibrated to have quality yield values in absolute and not only in relative terms (i.e. it can be considered that, even with a poorly calibrated sensor, a low yield should still appear lower than a high yield; despite the fact that the value in absolute terms is false). If the calibration is not perfect, it might be possible to correct, or at least improve the yield map, based on a reference yield value, the one obtained after weighing once the harvest is done for example.
- Despite all the precautions that will be taken, the yield map will never be perfect, in the sense that certain biases (even very small ones) will always be present on the map 1. All this to say that the profitability map must be used with a little hindsight, that is, it must be used to identify trends and orders of magnitude, production areas to work on. The objective is not to work on these maps at the centimetre scale, it would be absolutely useless (in addition to being biased).
- All of the farm’s expenses must be known and filled in (if possible automatically retrieved from a database or farm management information system). In order to make farmers aware of the use of these profitability maps, it will be really important to ensure that entering these expenses is not too much of a constraint. The scale of analysis of the profitability maps will depend on the scale at which the production costs are available (farm, plot or within-field scale). If modulation practices evolve, it would be quite conceivable to have variable production costs in the plots.
- Care will have to be taken to use profitability maps responsibly by not seeking to maximise yield and therefore turnover maps but rather margin maps.
- Once again, changes in practices can only be considered if alternatives to current production systems are proposed and sufficient financial incentives are put in place.
Profitability maps are one of the tools that could facilitate the evolution of agricultural practices, both in terms of “Efficiency” strategies (by optimising the existing production system by limiting the consumption and waste of inputs and resources but without changing the functioning of the existing system) and “Substitution” (by replacing the use of non-renewable and/or high-impact resources with resources with a much more limited impact on the environment), or “Re-design” (by tackling the intrinsic causes of the problem and rethinking the production system so that it no longer has to rely on external inputs) (see one of the previous post – Precision Agriculture in all intimacy). If they are deemed relevant, these profitability maps will also be an opportunity to make more use of yield maps (for instance in several services and/or agronomic models) which are still largely under-used in France.
Lerch, R.N., Ktichen, N.R., Sudduth, K.A., Myers, D.B., Massey, R.E, et al., (2005). Development of a conservation-oriented precision agriculture system: Crop production assessment and plan implementation. Journal of Soil and Water Conservation, 60, 421-430.
Massey, R., Myers, D., Kitchen, N., and Sudduth, K. (2008). Profitability Maps as an Input for Site-Specific Management Decision Making. Agronomy journal, 100, 52-59
Support Aspexit’s blog posts on TIPEEE
A small donation to continue to offer quality content and to always share and popularize knowledge =) ?

