Digital technologies are generally presented as a powerful lever for decarbonizing the agricultural sector, or even more broadly as tools to support agricultural transition(s), without always knowing what we’re going to put in them…
A blind spot in this proposal, however, remains the carbon footprint of these digital tools themselves. Still barely mentioned in the scientific literature, it would be a shame if the footprint of these tools were to outweigh the potential benefits they are supposed to bring.
Even if it’s hard to imagine that the carbon footprint of these digital technologies in agriculture will be significant compared to that of digital technologies in the broad sense (consumer use, other sectoral uses) or even compared to that of agriculture itself, broader reflections on the widespread deployment of these technologies could reshuffle the deck.
As the digital sector continues to dominate global greenhouse gas emissions, it will be necessary to make trade-offs regarding its use in agriculture, if digital technologies are deemed necessary.
This dossier on the carbon footprint of agri-tech is also an opportunity to capitalize on all the knowledge that is beginning to be capitalized on the platform of digital tools for agriculture (our new version is soon to be released). In addition to serving as a collaborative watch, this platform is now being used to take a step back from existing digital tools and identify trends.
Many thanks to Gaël Guennebaud and Pierre La Rocca (Inria), Olivier Rodriguez (La Fabrique des Possibles & Fresque du Numérique), and Eric Fourboul (Boavizta & Hubblo) for their time. Several articles, reports and webinars have enabled me to complete the interview feedback.
Happy reading!
Important preamble
This work follows on from a first blog entry written a few years ago. The former dossier was a fairly general introduction to the subject, focusing on digital technology in the broadest sense of the term, even if a few agricultural touches did punctuate the work as a whole. This new document takes a more in-depth look at the carbon footprint of digital tools in agriculture, and is part of a broader study of the role of digital technologies in agriculture.
Let me remind you that I write popularization reports, not scientific articles (although I have written some in the past). Nonetheless, these dossiers are very thorough and well researched. They are a synthesis (sometimes only slightly revised) of what I have read and/or heard from my interviewees. For me, popularization is not an oversimplification of reality, but a way of making science more accessible. I try to make this work as objective as possible, even if I do remain committed to my writing.
Please keep this in mind as you read this work!
A few reminders and current events on global warming
First and foremost, and this is a point that needs to be made regularly, human activities are causing widespread and rapid global warming. There’s no denying it. Of course, we need to act quickly to help reduce greenhouse gas emissions worldwide, but we also need to be able to anticipate future changes as effectively as possible (Figure 1), without having all the keys to a future that involves considerable time scales and remains difficult to predict.
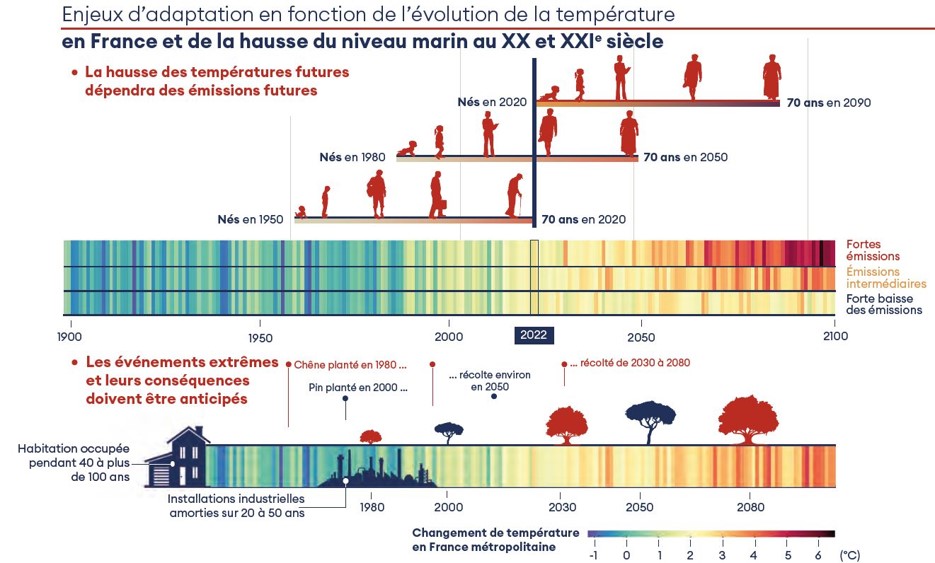
Figure 1: Adaptation challenges as a function of temperature evolution. Haut Conseil pour le Climat (2023). Children born in France in the 2020s will be in their thirties by 2050, and will experience warmer temperatures depending on high emissions scenarios.
Often masked by our anthropo-centrism and our tendency to focus on climate issues, the crisis facing biodiversity is dramatic. IPBES – the IPCC’s penchant for biodiversity issues – sheds light on the fact that positive action on biodiversity almost always results in positive impacts on climate (Figure 2). The converse is not true… Let’s not forget once again that the current biodiversity crisis is far more serious than the current climate crisis. The climate crisis is frightening, but it is perhaps the simplest of the problems we have and will have to deal with.
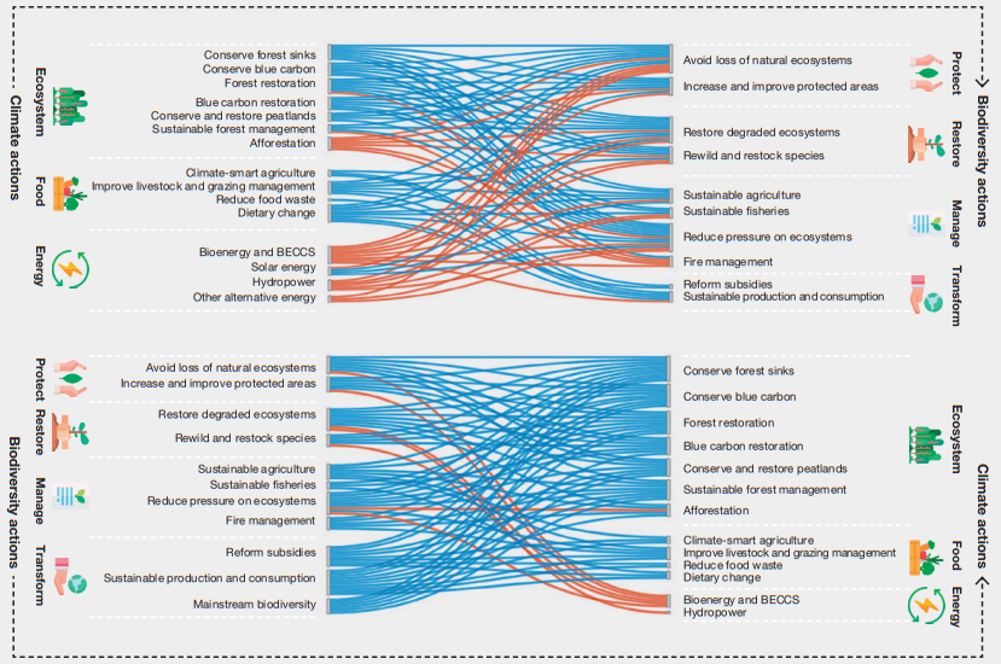
Figure 2: Impact of climate-oriented actions (left) on biodiversity (right). Bottom: impact of biodiversity-oriented actions (left) on climate (right). Red curves indicate negative impacts. Blue curves indicate positive impacts. IPBES (2022).
The year 2023 was particularly warm, as shown by the data reported by the Copernicus satellite constellations (Figure 3) and by the European Centre for Medium-Range Weather Forecasts (ECMWF) [Figure 4]. The curves show that 2023 was considerably warmer than previous years, not only on average, but on almost every day of the year.
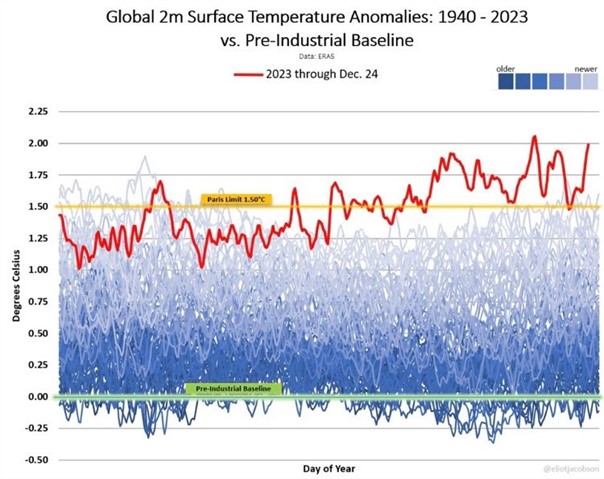
Figure 3: Estimates of daily mean surface air temperature differentials (2-meter height) over the period 1940-2023 compared with pre-industrial temperatures (green reference on graph) on a global scale. Each blue curve represents the temperature kinetics over a given year. The red curve is for the year 2023. There is a gradient of blue from the bottom to the top of the graph, with darker colors (lower temperatures) at the bottom and softer colors (higher temperatures) at the top, showing that the average daily temperature is warming on a global scale.
Particularly worryingly, the threshold of 1.5° additional warming compared with the pre-industrial period, set during the COP21 Paris agreements, was exceeded over much of 2023, mainly between July and December. The threshold of 2°C additional warming was even exceeded on a few days. These spectacular temperatures could be explained by a particularly strong El Nino phenomenon at the end of 2023, or by a reduction in the quantity of aerosols (which have a cooling effect). These temperatures could also prompt us to review the calibration of our climate models…
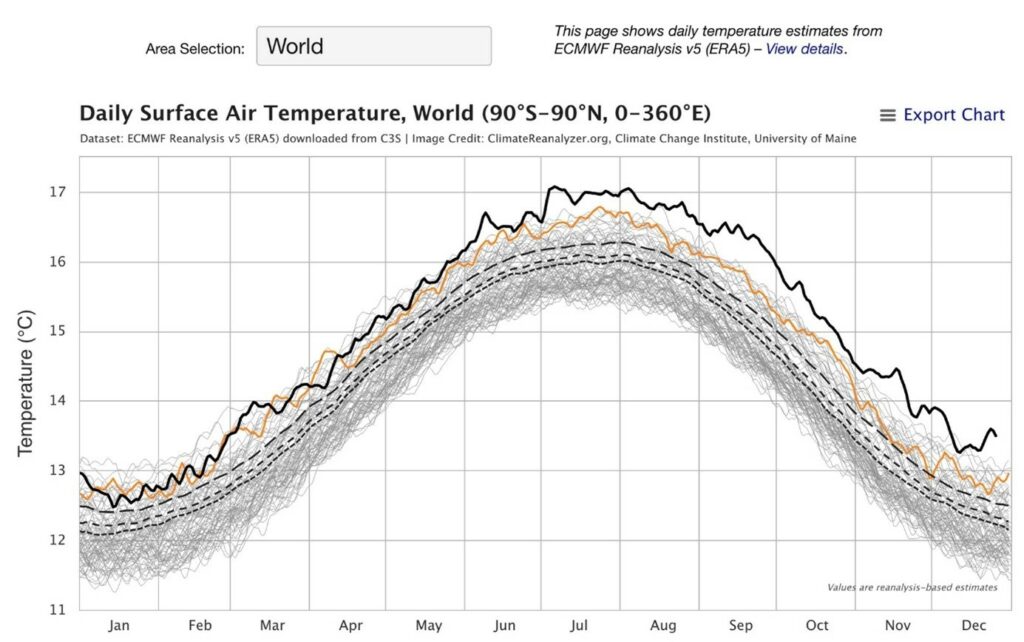
Figure 4: Global estimates of daily mean surface air temperature. Each grey curve is the temperature kinetics for a given year. The black curve is for the year 2023. Between July and December 2023, temperatures are disproportionately higher than in any other year on record.
Water surface temperatures (Figure 5) are perhaps even more worrying, and completely outside model prediction limits. The oceans are warming much faster than predicted, yet it’s thanks to them that the earth’s surface isn’t warming even faster…
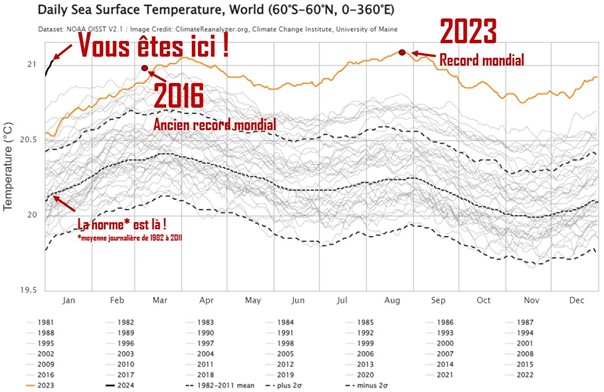
Figure 5: Global estimates of daily mean surface water temperature. Each grey curve represents the temperature kinetics for a given year. The black curve is for the year 2023. Current temperatures are far from seasonal normals.
A quick look at the carbon footprint of the digital sector in the broadest sense
The digital sector irrigates absolutely all our human activities. Responsible for over 4% of the world’s greenhouse gas (GHG) emissions, the digital sector is experiencing unprecedented growth, increasing its emissions by around 6% per year (The Shift Project, 2021). In France, the trends are slightly lower – around 2.5% of GHG emissions and an annual increase in emissions of between 2 and 4% (Haut Conseil pour le Climat) – but should not be taken lightly, quite the contrary. In France, all our digital tools consume more than ten percent of our electricity. The Shift Project estimates that GHG emissions could be reduced to an annual increase of 1.5% by adopting digital sobriety as a principle of action. The increase would certainly be lower, but clearly still on an upward trend…
Despite the progress made in terms of energy efficiency to produce, store or transport a kilobyte of data, all the constants are rising. The digital sector is no exception to these rebound effects – new usages, increased use of digital tools… – whose consumption far outstrips the sector’s efficiency gains (The Shift Project, 2021). These rebound effects can be broken down (The Shift Project, 2023) into :
- A usage effect, i.e. The desire to deploy new uses justifies the deployment of new capacities (the multiplication of video content calls for greater network capacities in mobility, etc.).
- A supply effect, i.e. the deployment of new capacity leads to the development of new uses (the possibility of viewing UHD videos while roaming, the need to renew one’s smartphone to take full advantage of this new service, etc.).
The term “backfire” refers to the fact that an increase in usage (new uses) comes at the expense of efficiency gains for a digital system. Although Jevons’ paradox argues for the inevitable appearance of backfires, there is as yet no formal proof in the scientific literature that a rebound effect necessarily generates this type of phenomenon.
Admittedly, the environmental assessment of digital technology is still in its infancy. Analysis is still immature, and the impact factors (or “product carbon footprints” supplied by manufacturers) that are supposed to quantify the effects of digital technologies are still too imprecise for those that exist. This is all changing, however. Impact allocation rules are beginning to emerge for life-cycle analyses in the ISO sense, with specific reference to digital technologies. At least three ministries in France have asked ADEME to work on the digital footprint in the early 2020s.
Since the 2020s, ADEME, ARCOM and ARCEP have been working together to establish the carbon footprint of the digital age, and to draw up a number of forecasts. The breakdown of this footprint is clear (Figure 6), and is mainly focused on the manufacture of equipment and terminals typically used by the population (smartphones, televisions, tablets…). Network architectures and data centers are, in absolute terms, in a completely different order of magnitude (Ademe, Arcep, 2023).
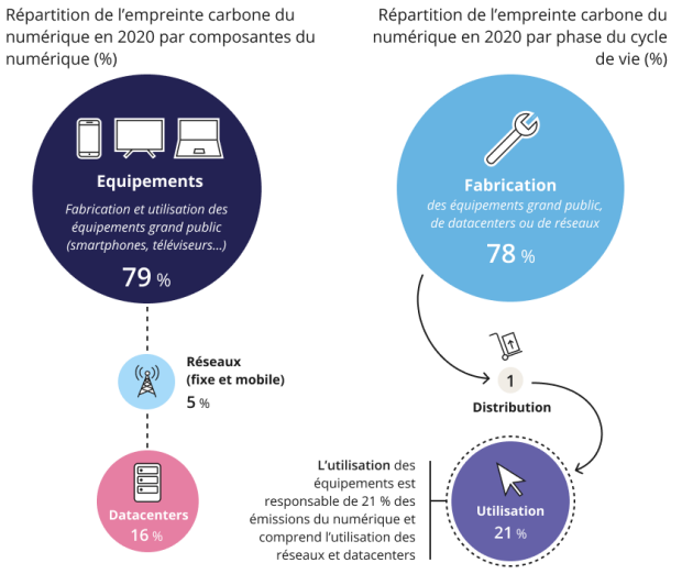
Figure 6. Breakdown of the digital industry’s carbon footprint in 2020 by digital component (left) and lifecycle phase (right).
Digging a little deeper into the ADEME-ARCEP report, one sentence intrigues: “IT equipment and infrastructures located abroad are excluded, even when associated with French uses.” In reality, this means that datacenters and networks operated outside France are not taken into account in this study. Given the widespread “cloudization” of our digital uses and the location of the datacenters that are ultimately used, one might be tempted to see a blind spot in this report. The arrival of generative artificial intelligences (Chat-GPT and the like), particularly those that can be used on a large scale by the general public, could reshuffle the cards in this distribution, as the production of new content on a regular basis is absolutely gigantic.
A contradictory study by Hubblo shows that the impact of datacenters outside France (as opposed to those in France) would be the majority for almost all the LCA indicators analyzed. The apparent discrepancy between equipment and datacenters in the ADEME-ARCEP report may in fact be much smaller than that seen here – in Hubblo’s view, it’s almost equal (50-50). To complete this analysis, Hubblo points out that it focuses here only on datacenters and not on (1) the imported part of networks, (2) the international and shared part such as submarine cables, or (3) datacenters operated in France for use abroad. In short, while the quality of the ADEME-ARCEP report is to be commended, the potential underestimation or misallocation of the impact on the digital spectrum is equally worrying.
The figures generally asserted on the digital footprint (those I have in fact repeated at the beginning of this chapter), must also be considered with caution. They concern subjects whose main function has to do with information technology (IT) in the broadest sense. Not everything related to digitization is included, however. For example, all the intelligence embedded in a Tesla autonomous car is not really considered here in this digital footprint because the function of a car is to drive. Instead, when we count the weight of IT, we refer to digital services and the underlying infrastructure. That’s good enough, you may say – but it’s probably underestimated.
ARCEP also points to more or less critical discrepancies between studies on the digital sector, leading to different evaluation results. Sources of variability include the use of different data sources, variations in the timeliness of the data used, and different approaches to the scope of the analysis (ARCEP 2023).
This current breakdown is explained in particular by the staggering quantities of materials required to manufacture our equipment. The extraction of ores and rare earths from mines, their refining in factories, the manufacture of electronic chips and the assembly of equipment are all energy-intensive stages (mainly of fossil origin). Added to this are all the transport stages from the mines to the refining plants (often far from the mines), to the production and assembly sites, and then on to the end-users (via a large number of intermediaries). The dematerialization or virtualization of the digital sector is thus a profound disguise of reality (Figure 7).
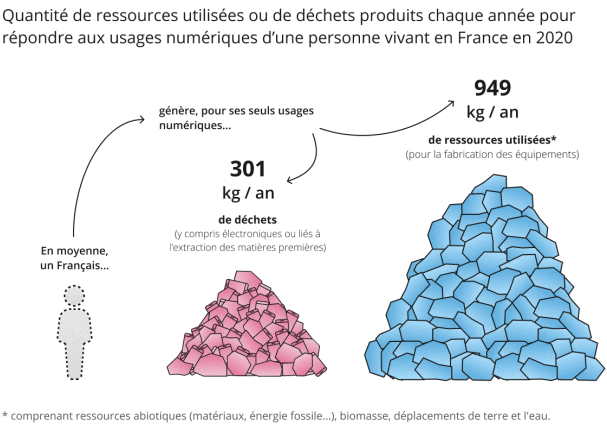
Figure 7. Quantity of resources used or waste produced each year to satisfy the digital uses of a person living in France in 2020.
The number of digital devices is not necessarily a good proxy for the associated carbon footprint (Figure 8). It all depends on its size and the equipment on board. For example, based on 2020 data, the very large number of connected objects represents 30% of total digital equipment, but only 5% of the overall digital footprint of terminals (Ademe, Arcep, 2023). Televisions and computers are the main contributors to today’s digital carbon footprint.
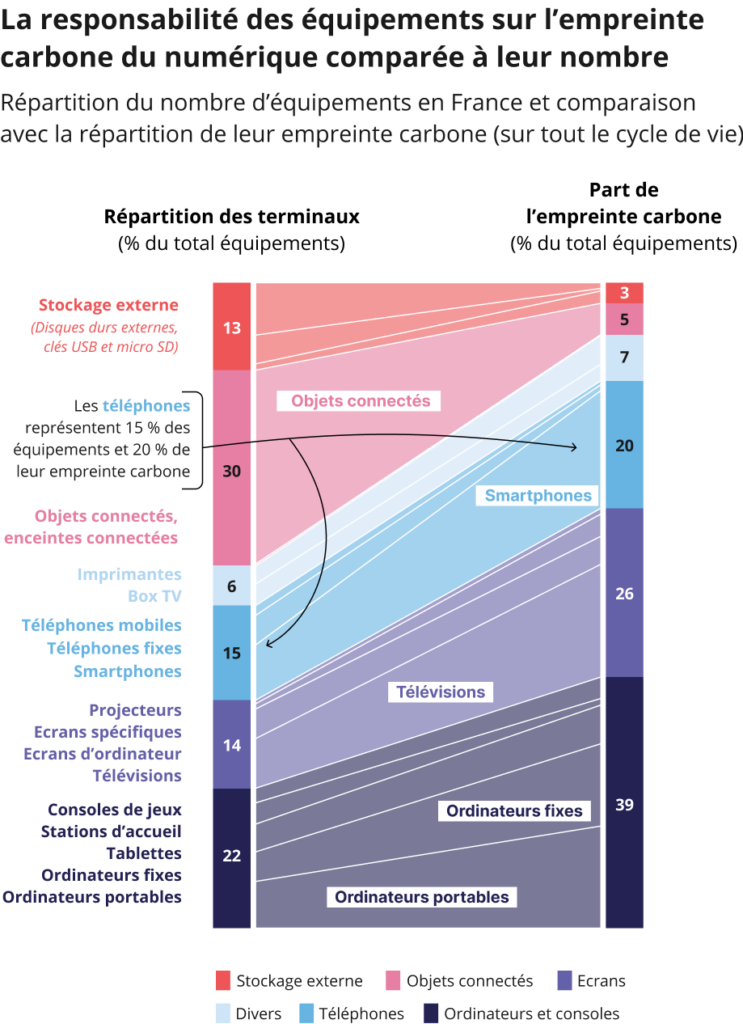
Figure 8. Breakdown of equipment in France and comparison with the breakdown of their carbon footprint (over the entire life cycle). Please note: the carbon footprint share is presented in relation to the total percentage of equipment. Network architectures and data centers are not considered here. In any case, these currently account for “only” 20% of the digital industry’s carbon footprint. In other words, the breakdown in this figure will not change too much.
Forward-looking studies by Arcep, Arcom and ADEME are highly instructive. In the business-as-usual scenario (i.e., without really acting on these digital trajectories), greenhouse gas emissions from the digital sector would increase by 45% by 2030, and triple by 2050. We can hardly imagine standing idly by when we compare these emissions increases with the current climate curves presented above.
On the legislative and regulatory front, there’s not much to be found in France, apart from the AGEC (Anti-Gaspillage pour une Economie Circulaire) and REEN (Réduire l’Empreinte Environnementale du Numérique) laws.
Feedback and results from the application of the REEN law seem to be relatively disappointing. The law’s fairly general measures are not accompanied by any sanctions if they are not respected. The observatory on the environmental impact of the digital sector, launched at the same time as the REEN law, bears witness to the fact that 2022 is clearly not the year in which emissions from the digital sector will have started to fall… We can nevertheless welcome the fact that the REEN law includes a territorial dimension for large metropolises, with the obligation to have a roadmap around responsible digital technologies by 2025 (these metropolises should have started working on this as early as 2023). It remains to be seen how this will be put into practice in our territories. However, the AGEC and REEN laws no longer really set targets. Instead, they are directly supported by ADEME and ARCEP.
The digital sector should finally be included in the revision of the national low-carbon strategy (SNBC, 3rd version). Even if this update has not yet been finalized at the time of writing, we can expect the reference trajectory considered to be at least in line with recent ADEME-ARCEP work, and even to take into account the notion of imported data centers highlighted by Hubblo’s contradictory analysis.
At European level, the digital footprint doesn’t seem to be causing much concern. Rather, digital technologies are seen as a resource to support Europe’s environmental transition (taken from the angle of the Green Deal). The European Union’s Digital Services Act does, however, call for environmental impact to be included in the regulation of major web platforms, which currently benefit from a limited liability regime. The call to regulate practices and content makes sense. Let’s hope it’s ambitious enough.
What about the carbon footprint of digital technology in agriculture?
What kind of digital technologies are we talking about?
By technology, we can quickly identify the digital tools available on the market. But you still need to know what exists in the digital ecosystem…
At Wiki Agri Tech, we have broken down this technology entry into 3 hierarchical levels.
- A first level of 5 classes – expressed with an action verb – to clarify the function or use of the tool on the farm.
- A second level clarifying the categories of tools available for each main function.
- A third level detailing the types of tools available in each of these categories. This is where you’ll find the names most commonly used when talking about digital tools in agriculture
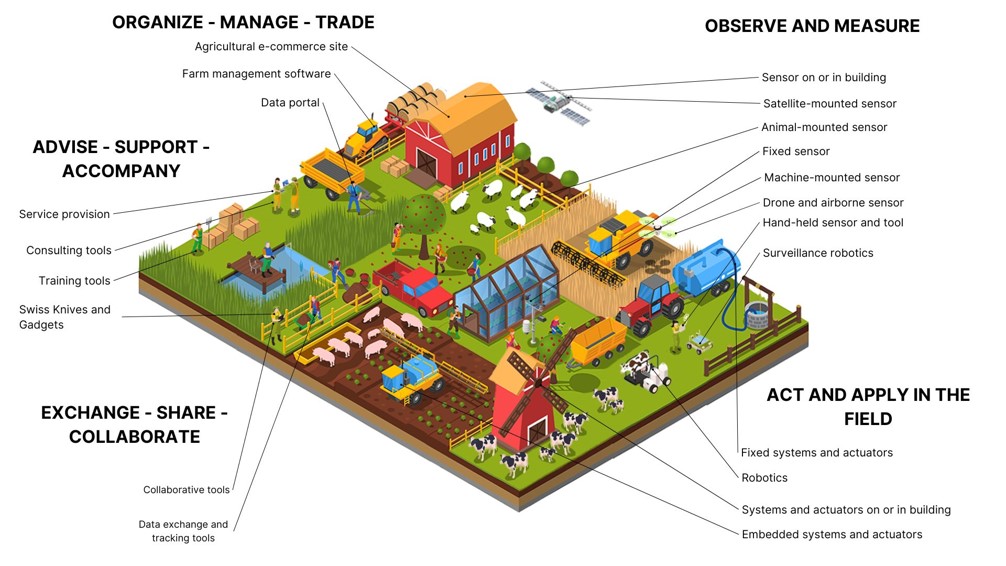
Figure 9. The five main functions of digital technologies in agriculture, right up to the farm gate. Source: Wiki Agri Tech. Read our white paper!
Our classification of digital tools offers a first classification so that everyone can picture the digital ecosystem up to the farm gate as a whole. Please understand that classification is complicated by the number and diversity of existing tools. Classifying a few dozen tools may seem reasonably accessible. But when we try to classify several thousand (the directory of digital tools for farmers currently counts over 1,500), the organization becomes far more complex.
Figure 9 brings together all the functions, categories and types of digital tools proposed. The five main digital tool functions we propose are detailed below:
Observe and Measure – this function covers all measuring instruments and sensors designed to collect data to measure, describe and quantify a soil, a plant or a stand, an animal, a flock or a herd, a climate, a topography, etc. This function also includes the data and sensors used to measure, describe and quantify a plant, an animal, a flock or a herd. This also includes geolocation data and services to support and/or improve geo-positioning on the farm. Scouting robots are also represented in this observation function – and are to be distinguished from those present in the last major function “Act and Apply in the field”.
Organize, Manage and Trade – this function brings together tools for centralizing and organizing data on and around the farm. This includes FMIS (farm management information systems), which structure and display data on plant and animal production, farm machinery and any other connected objects on the farm. We’ve also included data portals, whether open-source or not, that can be mobilized by agricultural players. Last but not least, we’ve included agricultural e-commerce sites (market places), which bring together structured information to enable the ecosystem to buy or sell production results or inputs. This “Organize, Manage and Trade” function may seem a bit of a catch-all, but in reality it brings together all the technologies needed to prepare, structure and manage data.
Advise and Support – this function mainly covers advisory tools (decision support tools come to mind, but the range is actually much wider, with tools for identification [of plants, diseases, animals, etc.] or assistance with machine settings, for example). Also included in this main function are training tools (still not very present on the market) and a category known as “Swiss Army Knives and Gadgets” (no disparagement intended), which often free up the farmer’s mental workload. A “Services” category has been added for requests and support that go beyond simple digital technology. Keep in mind that this category is more about companies than tools as such.
Exchanging, Sharing and Collaborating – This function covers tools that are concerned with data exchange and its derivatives (traceability, telemetry, exchange security, etc.), as well as collaborative technologies that enable users to work in teams, exchange information between peers, and meet up in groups.
Act and Apply in the field – a function that highlights digital technologies for acting in the field, once a decision to take action has been made. Unsurprisingly, we find here the vast majority of robotic technologies (to be distinguished from those dedicated solely to surveillance and present in the first major function), as well as actuators of various forms, mainly positioned to complement data collection by tools referenced in the “Observe and Measure” function.
We have restricted ourselves here to digital tools up to the farm gate. In other words, we have not considered all the tools used in the value chain downstream of production (agri-food industry, distributors, consumers, etc.).
What potential do digital tools have for reducing agriculture’s carbon footprint?
Agriculture accounts for a significant proportion of France’s carbon footprint (and the world’s, of course). Although not all phenomena are necessarily understood with extreme precision, we have a good representation of the different sources of agricultural emissions. In agriculture, the footprint is mainly due to emissions of methane (CH4) and nitrous oxide (N2O), which have far greater warming powers than the more widely known carbon dioxide (CO2). Methane comes mainly from the enteric fermentation of ruminants and the management of animal waste in anaerobic conditions. Nitrous oxide comes mainly from the application of mineral nitrogen fertilizers in crop production (volatilization of nitrogen, nitrification and denitrification in the soil, etc.). There are also CO2 emissions (in much greater quantities, but with a lesser greenhouse gas impact) via fossil fuel consumption for heating greenhouses, fuel consumption by farm machinery and the manufacture of mineral nitrogen fertilizers.
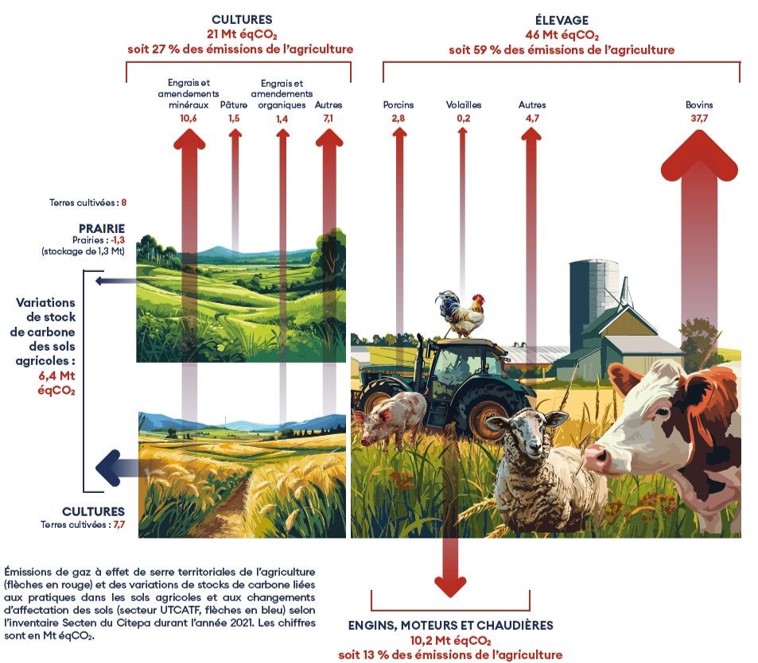
Figure 10. Schematic representation of agricultural emissions according to the Secten national inventory. Source: Haut Conseil pour le Climat (2024). Accelerating the climate transition with a low-carbon, resilient and fair food system.
Theoretically, all digital tools that deal in any way with these sources of emissions have the potential to reduce agriculture’s carbon footprint. And there’s no shortage of examples.
When it comes to nitrogen fertilization, there are countless digital technologies on the market. From integral nitrogen management models for the whole year, to tools for measuring nitrogen uptake to readjust forecast doses, to instruments for fine-tuning the management of final inputs during the season, the proposals range from reducing nitrogen doses to reallocating doses for greater nitrogen utilization efficiency. All these tools are mainly found in the “Observe and Measure”, “Advise and Support”, and “Act and Apply in the field” functions (Figure 9).
On the breeding side, digital heat-monitoring tools (especially, but not exclusively, connected collars) can help optimize the number of non-productive days for dairy cows, i.e. to ensure that cows calve earlier. In accounting terms, at constant milk production, this reduces the total time a cow feeds during her lifetime (since she lives shorter) and consequently the associated methane emissions. More on this later. Some companies have even started developing connected muzzles to measure and mitigate the methane levels emitted by cattle belching as a result of enteric fermentation.
Agricultural robotics are also coming up with new, lighter agri-equipment (which requires less energy to move around) and electric motors, enabling us to move away from our dependence on fossil fuels. Replacing heavy tractorized machinery with light, single-purpose or swarm robots could be a way of avoiding higher carbon emissions for the agricultural sector.
Soil’s capacity to store carbon is also a key factor in climate mitigation. Numerous digital tools have been deployed to accelerate or facilitate data collection, to measure the deltas of carbon stored in agricultural soils, or to transfer carbon credits between farmers or collective project leaders and carbon credit buyers. Labelling schemes (Label Bas Carbone, Verras VCS, etc.) and other incentives (chain premiums, product premiums) are just some examples. Digital tools thus indirectly help to reduce carbon emissions by helping to cut the cost of environmental monitoring and reporting, and to feed more automatically into the agronomic models used to account for carbon storage in soils.
Indirectly, digital tools could also help to facilitate commitment to these low-carbon itineraries – which is the whole point of environmental reporting (Huang et al., 2022; Liu et al., 2023). However, we may well wonder to what extent digital tools are blocking other, less carbon-intensive farming itineraries. This scenario is even more pernicious. It’s as if you were stuck in a local minimum and couldn’t reach a global minimum. The fact remains that we have little feedback on the ability of digital tools to really guide changes in practices.
Generally speaking, I’m far from neglecting the mitigation potential offered by digital agricultural technologies. If we think in terms of an iso-system, i.e. mainly in terms of optimizing the existing system, emissions reductions are real and potentially significant. The questions to be asked are of several kinds. Firstly, we need to move away from the carbon-only logic to which we are particularly sensitive. Secondly, we need to think more broadly about the question of widespread deployment of digital technologies, and not just by comparing one route with a digital tool to another without.
What are the decarbonization levers for digital farming?
In addition to the necessary sobriety that we’re having a devilishly hard time initiating, and which is most certainly our most important lever, the levers for decarbonization are well known in the digital sector – whether for agricultural or non-agricultural applications. Let us keep in mind that making digital compatible with our transition challenges does not consist of accelerating the optimization levers already deployed, but of placing it on a fundamentally different trajectory from the one it is currently following (The Shift Project, 2023)
Amongst the classic levers, this already involves increasing the lifespan of digital tools, given that manufacturing accounts for the majority of their carbon footprint (mastering design to make tools more robust over time, increasing battery lifespan by optimizing firmware to send less data, eliminating programmed obsolescence of all kinds…). We can also add to this, in a non-exhaustive way, better architectural design, the implementation of firmware so that customers can update their digital technologies and avoid product recalls or replacements, the use of low-speed networks to transfer data, etc…
We also hear talk of using AI to support the eco-design of digital services, in particular to optimize consumption. However, this overlooks the fact that most of the levers remain at the design level (specifications, user needs, maintenance, etc.) and not at the development level. All this needs to be thought out upstream, and that requires people to talk to each other, developers, designers, users…
The wealth of connected measuring instruments in agriculture generates a whole host of data: tabular (soil analysis, cultivation itineraries), spatial (plot contours, satellite images, data from sensors on machines), temporal or longitudinal (climatic data, machine consumption over time…), spatio-temporal (vegetation image history bank…), video data streams. ), spatio-temporal (vegetation image history bank…), video data streams… Ahmed Kayad and his 2022 team estimate the amount of data available on their study site at around 1GB per hectare, and imagine that this figure could double by 2025 (Kayad et al. , 2022). In view of the regular flow of data on social networks and streaming platforms, this figure may seem derisory. It all depends, however, on the next steps in the digital trajectory on farms and the type of sensors used on farms. This 1GB figure remains theoretical in my view of things, and masks a number of things: data is widely duplicated by all digital service providers using this data, and this data can be used to generate new data (recommendation maps, for example, or to set agronomic models in motion…). Of course, all this data has to be stored somewhere. Between those who collect data in the hope of doing something with it, and those who under-exploit the mass of data they collect, we’re not out of the woods yet.
Limiting the amount of data generated seems to be common sense, for example by measuring only what needs to be measured, or by reducing the amount of data sent from a sensor to a database. In my work, the spatial data I sometimes use (drone imagery, yield maps) are sometimes so heavy that I can’t even open them in my programming languages and geographic information systems. What’s the point of collecting very high-resolution data if you’re only going to aggregate it at much coarser scales later on? I understand that some information can only be accessed at a fine resolution (think of vegetation images in viticulture, for example, to discriminate between vegetation cover and inter-rows). Some service providers even go so far as to collect on-board images (on a drone or tractor) with millimetre resolution to try and detect disease outbreaks on leaves… With millimetre resolution!
Specialists use the term Edge Computing to refer to in-situ data processing, directly at the sensor’s image capture point, to avoid having to send a massive set of data and instead share only the information required. For a tractor-mounted camera whose objective is to identify the start of disease clusters, it will be more relevant to send only specific information (presence/abscence) than all the images collected, all the more so if they are at high resolution. On the other hand, Edge Computing is more limited if the raw data collected at the outset is to be reused at other times (for machine learning, for example). In this case, sending the degraded data only once makes less sense. Some companies will therefore prefer to use 5G networks and shared clouds, with all the cascading positive and negative impacts that this might entail.
Technological stacking and obsolescence also need to be questioned. Autonomous robots are not likely to replace a multi-tasking tractor (and this is not always taken into account in conventional LCAs). The question of sharing agricultural equipment (like sharing personal cars) is a major challenge in terms of reducing the amount of equipment developed. This type of collaboration already exists in part with CUMAs (cooperatives for the use of agricultural equipment) and deserves to be widely deployed with all agricultural equipment (including robots). A whole business model, based on the economy of functionality, needs to be brought to the fore.
Life cycle assessment in the Agri-Tech sector
Reading keys and functional units for Agri-Tech
The few bibliographical sources that deal with the digital footprint in agriculture almost exclusively use Life Cycle Assessment (LCA). Although I’m not a specialist in this field, I’d like to offer you a few keys to understanding its ins and outs.
Life Cycle Assessment (LCA) is a multi-criteria environmental evaluation method that broadens the pure and simplistic vision of the carbon-based approach. Some fifteen impact categories are assessed (global warming, eutrophication, acidification, ecotoxicity, etc.), sometimes aggregated into coarser categories. This is a “product” approach which, as its name suggests, is based on the life cycle, i.e. the entire life cycle of a product, from “cradle to grave” (from the materials used to manufacture the product to its end-of-life). LCA assesses potential global impacts in relative terms. It must therefore be understood that this approach is only of comparative value (even if some work is attempting to integrate absolute assessments, for example through planetary limits) and is unable to capture very localized impacts. For more local impacts, we prefer to use “site” approaches such as impact studies, which are generally better known to the general public. Site” and “product” approaches are truly complementary, even if it’s not always easy to get them to talk to each other.
LCA generally involves four stages of work:
- Defining the objective and scope of the study: this is certainly the most decisive stage, and will condition the rest of the work. This stage involves questioning the main function of the product in question and the functional unit that will serve as a common basis for calculating impacts (more on this later).
- A data modeling and inventory phase: this is undoubtedly the most time-consuming stage of the work, involving the construction and/or retrieval of footprint data from various databases.
- An impact assessment phase, which includes all the analysis in the broadest sense: characterization, normalization, impact weighting, etc.
- An interpretation phase, to improve or redesign the product or service, compare products, etc.
However, life-cycle analysis is still relatively new in an agricultural context. The first theses on the subject date back to 2005.
What is the functional unit of a digital technology in agriculture? This is the question Clémence Huck and her thesis team set out to answer. The European CODECS project, which forms part of this thesis, has a section dedicated to this environmental assessment. The functional unit enables us to compare the service rendered by a product on a clear basis. These functional units are linked to main functions or major services rendered. This functional unit can take many forms: a kilogram of wheat produced, a kilogram of product used, a hectare of cultivated land, an hour’s work for a given task, or an additional euro earned (Figure 11). Not all of these functional units are equal, and some are rather difficult to measure, such as the driving comfort of a tractor or the stress of a farmer (even if it could be approximated by various indicators such as the number of healthy days lost, low-frequency vibrations, noise, or back twists).
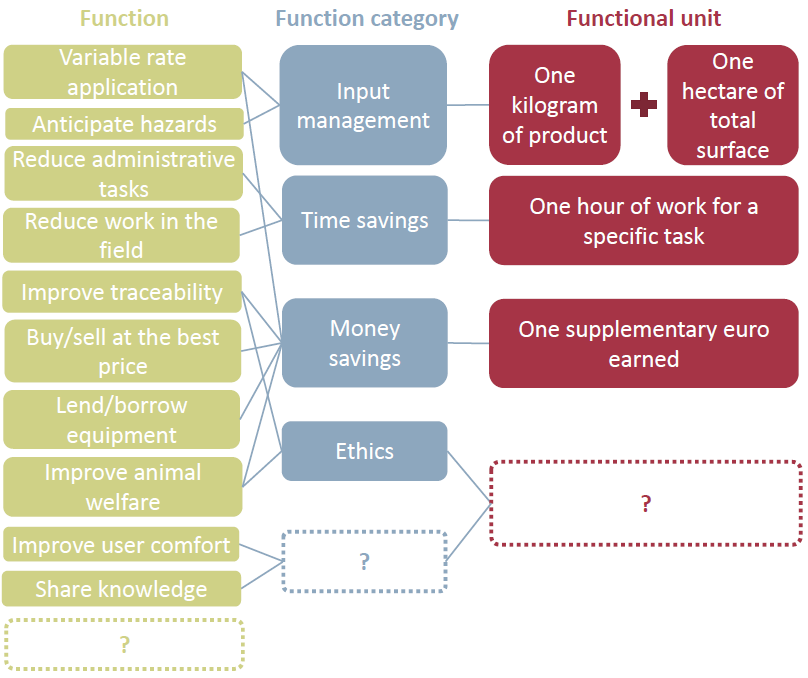
Figure 11. Suggested LCA functional units for assessing the impact of digital technologies in agriculture.
Certain functional units, such as the cost of a euro spent, can be used in several contexts (on the product used, on all the work carried out, etc.), making the choice of the right functional unit even more complicated. All the more so as, depending on the functional unit chosen, the LCA results could be drastically different. Looking at several functional units at the same time would therefore make more sense to broaden our spectrum and understand the benefits and trade-offs of a given digital technology. For example, by studying a digital tool from the angle of both a kilogram of plant production and a hectare of cultivated area, we are interested in the eco-efficiency of production and the intensity of the farm’s impact. Bear in mind that gains in certain functional units are not necessarily correlated with increased production (and may even be negatively correlated).
Some criticisms of current LCAs
At the time of writing, it cannot be said that the scientific literature abounds in LCA results for digital agricultural technologies. Even if some initial, fairly in-depth studies are beginning to emerge, notably on agricultural robotics, it’s difficult to identify any major orders of magnitude.
In my introduction to LCA, I stressed the relative aspect of the approach, in that it is only comparative. It is therefore important to compare comparable things. In the short existing literature, not to mention LCAs, comparisons are made difficult because the methods of analysis are not always comparable: carbon footprints according to the carbon balance method, GHG protocol emissions, impact studies or even complete life-cycle analysis. Even within LCAs, methodologies are not always identical. Some works refer to different analytical frameworks or aggregation methods, such as “World Impact”, “ReCiPe” or “Environmental Footprint”, making comparisons dangerous. To go even further, it is sometimes even difficult to objectively compare case studies explored with the same methodology. In their LCAs on the use of wine-growing robotics, Marilys Pradel and her team point out that the notion of “optimal dose” of weed control varies according to the terroirs analyzed (Pradel et al., 2022). LCAs between wine-growing terroirs therefore seem very tricky to compare. The results will depend on the area studied, the practices used and the crop grown…
What reference should you compare yourself to? Can we really compare a route with one or more digital tools to another route without any digital tools at all? The boundary is perhaps more porous than it seems. Take, for example, the case of nitrogen fertilization modulation in arable farming. One could imagine wanting to compare the environmental footprint of a 1kg cereal crop fertilized conventionally (homogeneous fertilization on the plot defined by agronomic expertise) with that of the same crop fertilized with the support of a satellite fertilization service (modulated fertilization on the plot defined by a radiative transfer algorithm and calibrated by plot analyses). This comparison would make it possible to consider fertilization management in all its complexity, including :
- Conventional fertilization: field expertise, quantity of inputs used, efficiency of nitrogen use, farm machinery used…
- Modulated fertilization: field expertise, quantity of inputs provided, satellite service for defining nitrogen doses (image acquisition and analysis), efficiency of nitrogen use, farm machinery used, adaptation of machinery with modulation tools, etc,
But can we be sure that a farm advisor, in the context of conventional fertilization, uses absolutely no digital tools? In the same way, a digital service can only exist if it is based on existing architectures. By this I mean that, rather than a digital service, it’s an accumulation of mutually compatible services that leads to a final service. What is the real contribution of the final digital tool without the previous tools?
Note that, at present, the main uses of life cycle assessment (LCA) in an agri-tech context seek to evaluate the interest of modulation approaches with regard to the quantity of product applied (nitrogen, phytosanitary…), without always focusing on the effectiveness of the reduction in product use (it is often a reduction in product that the studies seek to highlight) on the volume or quality of subsequent production. In some articles, the reduction in product use is even modelled, rather than actually measured in the field.
The digital sector seems to be lagging behind in terms of LCA. Data is scarce, and translating uses, processor calculations and data storage in terms of environmental impact is not yet homogeneous. The fact that the sector and technologies evolve very rapidly limits the definition of calculation recommendations. Carbon footprint databases for digital equipment are, in some cases, old and underestimated. For example, the majority of agricultural equipment is still considered to be scrap metal, which is surprising given the amount of on-board electronics (including consoles) and the digital models and sensors embedded in these machines. These underestimates can also potentially penalize the arrival of other digital tools such as robots, when compared with tractors on the market whose carbon databases are older (Pradel et al., 2022).
LCA approaches in the literature are often based on a methodology defined as “cradle to farm gate” (i.e., we generally stop at agricultural production without going too far down the value chain) with fairly conventional processes (material extraction, manufacture of inputs and equipment, emissions due to product inputs [fertilizers, glyphosate, diesel or other]). One could also get the impression that the full environmental cost of the associated service is not taken into account. While it is generally the quantity of inputs resulting from the use of a digital tool that is often the target of LCA, no attention is paid to the overall state of the digital service, which will undoubtedly require maintenance, travel, or new infrastructures to be developed. The work is often vastly underestimated, since questions of infrastructure, research and development, or even chains of dependency and compatibility in the manufacture of digital tools are not considered.
Uncertainty and sensitivity analyses are still lacking in Agri-Tech LCAs. However, they are necessary for a broader benefit-risk analysis. In the field of electrified robotics, for example, studies have shown that electric batteries have the greatest impact on the robot’s production phase (Laglenov et al., 2021). For regulatory reasons, autonomous robots are not yet allowed to operate alone in the field, let alone cross roads to change work plots. Packing robots into trailers to move them from plot to plot actually has a very significant impact (Pradel et al., 2022) in terms of the fuel consumption of the transporters; this impact is all the greater when the plots are small and far apart.
We need multi-year studies to realize the real relevance of a digital tool. Let’s take the case of parasite pressure in viticulture, for example. In good years, by which I mean years without too much pressure, viticultural treatment practices (sprayer settings, choice of nozzles, decision support tool to assist treatment frequency) are not as useful as in difficult years.
Most digital tools work at plot or farm level. But what happens when these tools are used on a larger scale? What happens, for example, when the scale is changed to that of a watershed, a region or even the whole of France? By way of example, soil probes installed to fine-tune irrigation management at plot level could generate rebound effects in the sense that if everyone is more efficient in their use of water at plot level, they might decide to irrigate in greater quantities.
Attributive and consequential LCAs
As I understand it, the majority of current life cycle analyses are “attributional”, in the sense that the study is reduced to functional units and then extrapolated to larger scales. LCA results give impacts in different categories, which we try to attribute to uses or services rendered. In this way, we can say that we are looking into the past. Sometimes, this allocation is relatively easy. We can, for example, imagine a relatively simple digital tool serving a specific purpose. It’s even more complicated with multifunctional systems – take, for example, a farm tractor that serves several different purposes. In the case of shared or multiservice equipment (network infrastructure, data centers, etc.), attribution approaches will tend to attempt to distribute the impacts between these items of equipment (in particular, we’ll talk about allocation, substitution or subdivision to distribute these impacts). And if there’s one place where an LCA can be made to say anything and everything, it’s at the level of impact allocations. Allocation by mass? By price? By energy? The ideal is to use an allocation unit that is as functional as possible. When we can’t find one, financial allocation is generally the most appropriate.
The attribute approach nevertheless masks temporal dynamics. The programmed obsolescence constraints of digital technologies, for example, can generate cascading obsolescence phenomena on entangled technologies.
“Consequential” LCA approaches reason in a different way, and tend to lead to broader impacts than attributional approaches. These methods use models to simulate scenarios and understand the impacts of initial assumptions. Whereas attributive LCAs describe the flows of the system under study, consequential LCAs seek to understand how these flows evolve when the proposed scenarios change. Even before accounting, the idea is to imagine what might happen. These approaches are therefore more decision-oriented. In particular, we speak of “short-term” and “long-term” consequentials.
For example, the input will be a detailed description of the types of farms present in the area where the digital equipment will be developed, changes in farms over time, or the type of technologies implemented. By broadening the scope of analysis, consequential LCAs can provide access to the indirect impacts of widespread technological deployment. The change in scale mentioned above is a case in point. If we imagine that digital agricultural technologies will require 5G infrastructures to operate, then we need to think about the wider deployment of base stations and network architecture to achieve this, which will generate impacts on a scale larger than a single farm (something that might not have been imagined with a conventional LCA on the scale of a farm plot). Note, however, that consequential LCAs need attribute LCAs to have access to orders of magnitude of impact that they can then use in their scenarios.
The two approaches – attributional and consequential – are not at all incompatible. Rather, attributional logic should be seen as a control function to ensure that the path traced by the consequentialist produces the desired results (Roussilhe, 2023).
Let’s take a step back
Is the digital footprint in agriculture really that large?
How can we position the carbon footprint of digital farming in relation to the overall footprints of digital farming and agriculture? The phase of carbon emissions during agricultural production, in the field, is so enormous that it hardly seems conceivable that digital equipment should play a dominant role in the agricultural carbon footprint (Figure 12). Similarly, the massive use of streaming and online videos by the general public would hardly suggest that the carbon footprint of digital technologies in agriculture exceeds that of watching cat videos in 4K resolution. Let’s also bear in mind that a certain number of digital infrastructures will be created regardless of the level of deployment of agricultural technologies, simply because they will serve other uses and economic sectors. Nevertheless, let’s not be more royalist than the king, as all this has to be measured – perhaps more so for some technologies than for others (generative intelligences or robotized tools, for example).
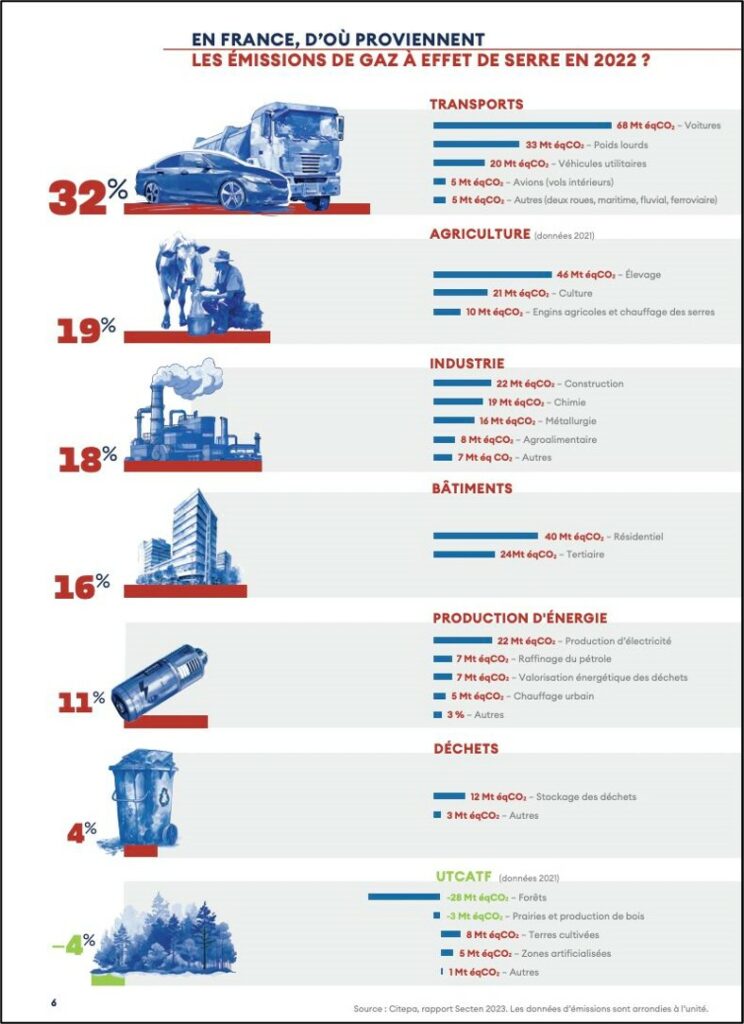
Figure 12. Greenhouse gas emissions in France in 2022, by major sector.
The issues raised by digital farming are perhaps not so much in its carbon footprint as in broader questions of resilience (problems of supply of materials and resources, etc.) and technological dependence (both from a social point of view, but also in terms of the dependence of one technology on another). All this will be discussed in greater detail in a future work.
At present, it’s hard to imagine a decline in digital tools in agriculture (both in terms of infrastructure and terminals, but also data) when we observe the trajectories taken by the digital sector as a whole.
New satellite constellations (Trishna, Earth Daily Agro…) are on the horizon, with ever finer spatial, spectral and temporal resolutions that will potentially be used to create new services in agriculture (with thermal spectral bands in particular) or to sharpen existing models. In early 2024, John Deere announced its partnership with Starlink, Elon Musk’s low-orbit satellite internet. Agricultural robotics are now widely deployed, perhaps not yet in the fields, but certainly at least in people’s minds. And in market gardening, technology can be heavy. The company Neofarm, which recently filed for bankruptcy, was developing vegetable farms using assisted or autonomous rails and robots. Low-code and no-code tools are taking market share, leaving anyone with the ability to develop professional applications without necessarily taking an interest in the architectural design of their application.
Generative artificial intelligence (AI) is being used in chatbots for agricultural applications to interact with the user in ever finer detail, or to generate posts, e-mails and content on demand. The first studies on the environmental footprint of generative AIs are starting to appear, showing energy consumption at orders of magnitude out of all proportion to more conventional techniques. AI-based applications could lead to new uses calling for new generations of network protocols, and consequently requiring the updating of digital equipment and terminals.
The air rush generated by the arrival of (new) digital technologies creates dependencies and technological overlaps of all kinds. Process automation tools such as Zapier or Make (and indeed a good proportion of low-code/no-code tools) also integrate artificial intelligence modules enabling them not only to generate content, but to automate its generation in a loop. Generative AI modules then become a simple building block in a broader process…
Marketplaces for GPT assistants are now springing up, where anyone can buy digital assistants more or less well-trained to generate content (why not agricultural content). “Generalized prompting” – that interaction on a console with a generative intelligence – is likely to become a sought-after skill (some are already selling prompts off the shelf). Just look at the number of new services based on generative intelligence being developed every month, and you’ll feel dizzy… The moratorium of a few months launched at the beginning of 2023 by a tribune of influencers and scientists on the subject of artificial intelligence, to give us time to take a step back, could make us smile. The European Union’s AI (Artificial Intelligence) Act seems to be far more concerned with ethical and security issues than with carbon footprints and the wider environment.
Software companies tend to install very large solutions, even if customers only activate the services they subscribe to. To what extent is this the case in agriculture? I’ll let you be the judge, but I won’t be surprised if you ultimately only use a small part of the capabilities of your plot management software for those who use it. A large part of the stored data would be little or not used. This is what the Databerg report reveals (an image of an iceberg of data of which the hidden phase – the submerged part of the iceberg – is the majority) from the Veritas firm released in 2015. These are data duplicated by the systems (in duplicate on the hardware therefore) but also all the gray data, namely the data which comes from your operating system without really knowing what is in it and which encourages you to renew your hardware. For example, our smartphones are quickly saturated with system, application and user data.
Cloud service providers are pushing to come to them by arguing that the costs will be the least expensive for constant use. But the energy consumption of these GAFAMs and others is still growing absolutely and it remains difficult to assess the footprint of a cloud because the calculation methods of certain suppliers allow them to take carbon offsets into account. So all of this is very vague. A few years ago (this is still the case for some, we agree), companies had so-called “on premise” data centers, that is to say that the IT and software infrastructures were hosted and maintained by the company’s own IT department. We had to order servers and take care of them. Now, everyone can easily install an instance on the cloud – we are talking about “serverless” solutions. It is thus a disproportionate acceleration that we are witnessing in the sense that it is always faster for a company (start-ups for example) to arrive on the market with an offer of services since everyone can deploy very advanced digital infrastructures and very quickly. Low-code/no-code tools hasten or further activate this phenomenon.
ARCEP and ADEME, in their prospective work, are assessing what the range of digital equipment could look like by 2050 (Figure 12). The four 2050 transition scenarios show an explosion in the quantity of terminals, particularly in the “green technologies” and “restorative bets” technological scenarios, with a gigantic quantity of connected objects. What proportion will it be in agricultural and agro-industrial contexts? Nothing has been done… Even if the unit footprint of connected objects is smaller than that of other terminals (Figure 8), these objects also call for new uses and require access to other terminals (smartphone, computers, etc.). ) to be able to exploit the results.
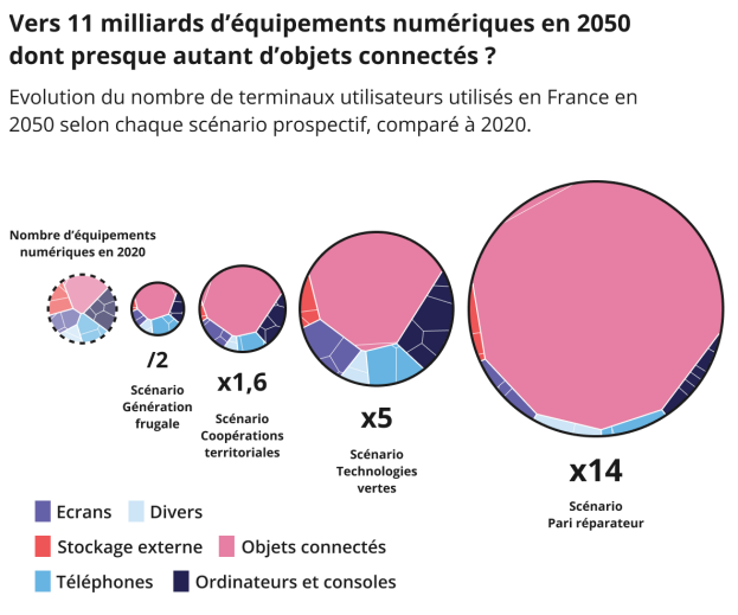
Figure 12. Evolution of the number of user terminals used in France in 2050 according to the four ADEME transition scenarios, compared to 2020.
All these digital tools will consume energy to operate (I refer you to the introductory figures in the blog file). Energy transition scenarios for France, whatever they may be (ADEME, RTE, Négawatt) rely on a reduction in the total quantity of available energy. Trade-offs will be necessary in the use of energy across all economic sectors. Even if food security issues will certainly be at the top of the pile and will put the agricultural and agro-industrial sectors in a strong position on this allocation (all of this says nothing about the future agricultural model – we agree) , the game will not be a long, quiet river.
Experience has shown that the deployment of new digital technologies always calls for new uses whose impact is far greater than the gains generated by the energy efficiency of digital equipment and infrastructure. So many questions for the moment without answers…
- Could the deployment of digital tools call for other digital tools to be added to the existing ones?
- Could the arrival of new digital technologies incompatible with previous ones accelerate the planned obsolescence of old digital equipment?
- Would digital technology not used to its full potential have a negative impact?
- Could digital tools block less carbon-intensive agricultural routes?
- Could digital tools, on the contrary, support the adoption of less carbon-intensive agricultural routes?
Carbon and Agri-Tech – an often technical reading of the problem
The carbon-centered approach sometimes condemns us to a very technical reading of agriculture. The use of connected collars to detect the heat of dairy cows is certainly a way of reducing milk emissions per liter produced (by reducing the duration of calving) but it is also a vision of the animal as a production tool , with a given lifespan.
Figure 14. The carbon reading prism.
This carbon approach can give the brain knots as agriculture must be considered from a systemic point of view. An increase in irrigation could help increase the yield of crop production. It is therefore potentially, per tonne produced, an interesting investment in terms of carbon (it all depends on the energy used to provide the water). In addition to the issues of water scarcity which are obviously fundamental, we could also imagine the case where this increase in yield requires greater drying operations and energy costs and therefore ultimately, a greater carbon footprint. With a higher yield, there is potentially also an additional demand for freight transport which, due to fossil fuels for the moment, adds to the general carbon footprint of agricultural production.
I am often surprised when we compare a “classic” agricultural route to a “technological” route because we often tend to compare a trend scenario or as it currently stands to a scenario taking advantage of jumps or significant technological advances. All of this ultimately leaves little room for alternatives. An old blog post led me to question the place of technologies in viticulture, and in particular agro-equipment, in meeting the objectives of the Ecophyto plans. If we compare the current state of vineyard spraying to a high-tech scenario with, for example, latest generation sprayers and on-board Lidar sensors to model the 3D architecture of the vine; there is no doubt that the technological option makes perfect sense. But is the reference so well chosen? By this I mean that the current state of spraying could be greatly improved by better training (for all farmers, advisors, dealers, etc.) on the adjustment of machines, the choice of nozzles, or even the use of sprayer in the field… Once these improvements have been made, the gap between the new reference and the high-tech scenario is certainly reduced and the technological option then perhaps loses its interest.
Reducing the agricultural carbon footprint must be planned at the right pace and with a long-term vision. Technological levers cannot be the first gateway because they are perhaps no longer that relevant when other less technological levers (sometimes focused on sobriety) have been activated. Following on from the classic ERC vision (avoid, reduce, compensate), we could here propose the ESA vision (Avoid, Substitute, Improve) and this, in this order, to maximize the chances of achieving the objective. To return to the example presented above around Ecophyto, it would first be preferable to avoid (by better choosing nozzles or by better adjusting existing equipment), then to substitute (for example by switching from chemical weeding to weeding). mechanical) and then, if everything has been avoided and substituted, to imagine improvements (by acting on the sprayer fleet with a more efficient fleet). This order makes it possible to avoid having to renew too large a fleet if some of the avoidance and substitution actions have made it possible to reduce a large part of the previous footprint.
Impact of global warming on digital
No need to imagine it, we have already experienced it. In 2021, the global digital ecosystem shuddered over the shortage of semiconductors, mainly caused by a major drought in Taiwan, which is home to the TSMC company. Several hours a week, the population was deprived of water to allow the company more capacity to produce its chips, despite slow manufacturing.
In the Atacama Desert, the natural absence of water is leading companies looking for lithium (necessary to operate certain digital infrastructures) to build seawater desalination plants near the Pacific Ocean for bring to their production sites; the factories are often powered by coal-fired power stations.
At the end of 2023, the Norwegian government gave the go-ahead to prospecting the Arctic seabed to look for the presence of polymetallic nodules (I refer readers to a masterful interview with Aurore Stéphan on the subject of these nodules on Thinkerview). Repeated interventions by activists have for the moment prevented this prospecting from transforming into exploitation of the seabed. If the presence of these nodules is proven, the sums involved will certainly quickly tilt the argument.
In France, drought alerts have been issued in 2022 in the Isere valley, which is home to the ST Micro Electronics company.
As a conclusion
Digital technologies are not unanimous. On the one hand, France and Europe are pushing for widespread deployment of digital tools and digital transformation. On the other hand, voices are calling for a complete reorientation of the digital system or for a digital de-escalation, sometimes much deeper than simple sobriety. When we observe the digital trajectories and the associated carbon footprints, there is indeed reason to ask the question. Digital is a catalyst. Where it is deployed, it makes it possible to optimize, accelerate, streamline, parallelize… Deploying it without a strategy therefore leads to the acceleration of all dynamics, including those furthest from our resilience objectives (The Shift Project, 2023) .
The aim of this blog file was not to blithely bang on about the carbon footprint of digital technologies in agriculture but rather to offer elements of reflection on a subject that has barely been discussed yet. There is a need for a quantitative assessment of the impact of these technologies in clear production contexts, especially since these impacts can occur on different time scales. Perhaps we need to start with the agricultural case studies that have the largest carbon footprints (nitrogen fertilization, enteric fermentation of ruminants, management of livestock effluent, etc.) and assess the potential for reducing the carbon footprint enabled by digital technologies, taking into account the footprint of the technologies themselves.
Thinking more broadly than at the scale of an agricultural plot appears necessary. Given the carbon footprint of the agricultural sector and the digital sector, it is reasonable to think that the carbon footprint of digital technology in agriculture will not be significant. On the other hand, a generalized deployment of digital technologies on the scale of a larger territory such as a region or a country like France raises new questions that need to be addressed. These questions will perhaps be more of the order of resilience, dependence and technological stacking, or even food sovereignty. Technology calls for technology, that no longer needs to be demonstrated. The dependencies between technological bricks are ever stronger and we must collectively question the trajectory we are taking.
The demand in terms of life cycle analysis seems to be moving towards ex-ante evaluation, that is to say, in the context of digital technologies, towards evaluations of digital tools before they are deployed, which would limit our risk of finding ourselves faced with a fait accompli.
Bibliography complementary to the interviews
Ademe (2022). Evaluation de l’impact environnemental du numérique en France et analyse prospective. Evaluation environnementale des équipements et infrastructures numériques. Rapport 2/3. Synthèse.
Ademe, Arcep (2023). Evaluation de l’empreinte environnementale du numérique en France en 2020, 2030 et 2050. Dossier de Presse.
Anser, M.K., et al. (2021). The role of information and communication technologies in mitigating carbon emissions: evidence from panel quantile regression. Environmental Science and Pollution Research, 28.
Arcep (2023). Evaluation de l’impact environnemental des TIC : analyse des écarts méthodologiques. Comité d’experts techniques sur la mesure.
Balafoutis, A.T., et al. (2017). Life Cycle Assessment of Two Vineyards after the Application of Precision Viticulture Techniques: A Case Study. Sustainability, 9.
Banecetti, J. (2020). May smart technologies reduce the environmental impact of nitrogen fertilization? A case study for paddy rice. Science of the Total Environment, 715.
Duval, B.D. et al. (2016). A case study of environmental benefits of sensor based nitrogen application in Corn. Journal of Environmental Quality.
European Commission (2022). Towards a green and digital future. Chapter Agriculture – page 23-31.
Fotia, K., et al. (2021). LCA-Based Environmental Performance of Olive Cultivation in Northwestern Greece : From Rainfed to Irrigated through Conventional and Smart Crop Management Practices.
Huang, X., et al. (2022). The impact of digital technology use on farmers’ low-carbon production behavior under the background of carbon emission peak and carbon neutrality goals. Frontiers in Environmental Science.
Hubblo (2023). Impacts importés des datacenters : l’angle mort des analyses territoriales des impacts du numérique:
Huck, C. (2022). Mobiliser la méthode de l’Analyse du Cycle de Vie pour évaluer l’impact environnemental des outils numériques en agriculture. Mémoire de fin d’études.
Huck, C., et al. (2023). Assessing the environmental footprint of digital agriculture : research perspectives. Poster. European Conference on Precision Agriculture.
Kayad, A., et al. (2022). How many gigabytes per hectare are available in the digital agriculture era? A digitization footprint estimation. Computers and Electronics in Agriculture, 198.
Lagnelov, O., et al. (2021). Life Cycle Assessment of Autonomous Electric Field Tractors in Swedish Agriculture. Sustainability. 13
La Rocca., P. (2023). Towards a methodology to consider the environmental impacts of digital agriculture.
Liu, C. et al. (2023). Does Digital Technology Application Promote Carbon Emission Efficiency in Dairy Farms? Evidence from China. Agriculture, 13, 904.
Nunez-Cardenas, P., et al. (2022). Environmental LCA of Precision Agriculture for Stone Fruit Production. Agronomy, 12.
Pradel, M., et al. (2022). Comparative Life Cycle Assessment of intra-row and inter-row weeding practices using autonomous robot systems in French vineyards. Science of the Total Environmental, 838.
Roussilhe, G. (2023). Les émissions évitées de la numérisation. Blog de Gauthier Roussilhe (https://gauthierroussilhe.com/articles/les-emissions-evitees-de-la-numerisation)
Roussilhe, G. (2023). Point de méthode et perspectives de recherche. Blog de Gauthier Roussilhe (https://gauthierroussilhe.com/articles/nouvelles-perspectives-de-recherche)
The Shift Project (2020). Déployer la sobriété numérique.
The Shift Project (2021). Impact environnemental du numérique : tendances à 5 ans et gouvernance de la 5G.
The Shift Project (2023). Planifier la decarbonation du système numérique en France : cahier des charges. Note d’analyse
The Shift Project (2023). Des réseaux sobres pour des usages résilients. Rapport Intermédiaire. The Shift Project (2023). Quels mondes virtuels pour quels mondes réels. Rapport intermédiaire.